
KPIs for consulting services tell you whether your firm is on track to achieve its objectives or falling short.
Without tracking these metrics, you can’t objectively evaluate performance in key areas like financial health, resource utilization, client acquisition, and project efficiency.
Boost your project success and profitability by accurately measuring the 11 most important KPIs for consultants.
1. Total revenue
Total revenue is the sum of all income from your consulting firm’s projects and services over a specific period.
Example
Let’s say your company completed three projects last month:
- Project A: $50,000
- Project B: $75,000
- Project C: $25,000
Your total revenue for the month would be $150,000.
Why it matters
How much money you have coming in is the most basic indicator of your financial health.
By monitoring total revenue over time, you can:
- Identify trends in your firm’s financial performance
- Set realistic financial goals
- Make informed decisions about resource management and expansion
How to track it
Add up all income from your projects for a given period (such as monthly, quarterly, or annually).
Smaller consultancies can do this using Excel or a Google sheet. List all your projects and their corresponding revenues, and then add up the total.
But as your firm grows and your project load increases, manually tracking everything will eat up way more of your time. You’ll need a system that can automatically handle more financial data, faster.
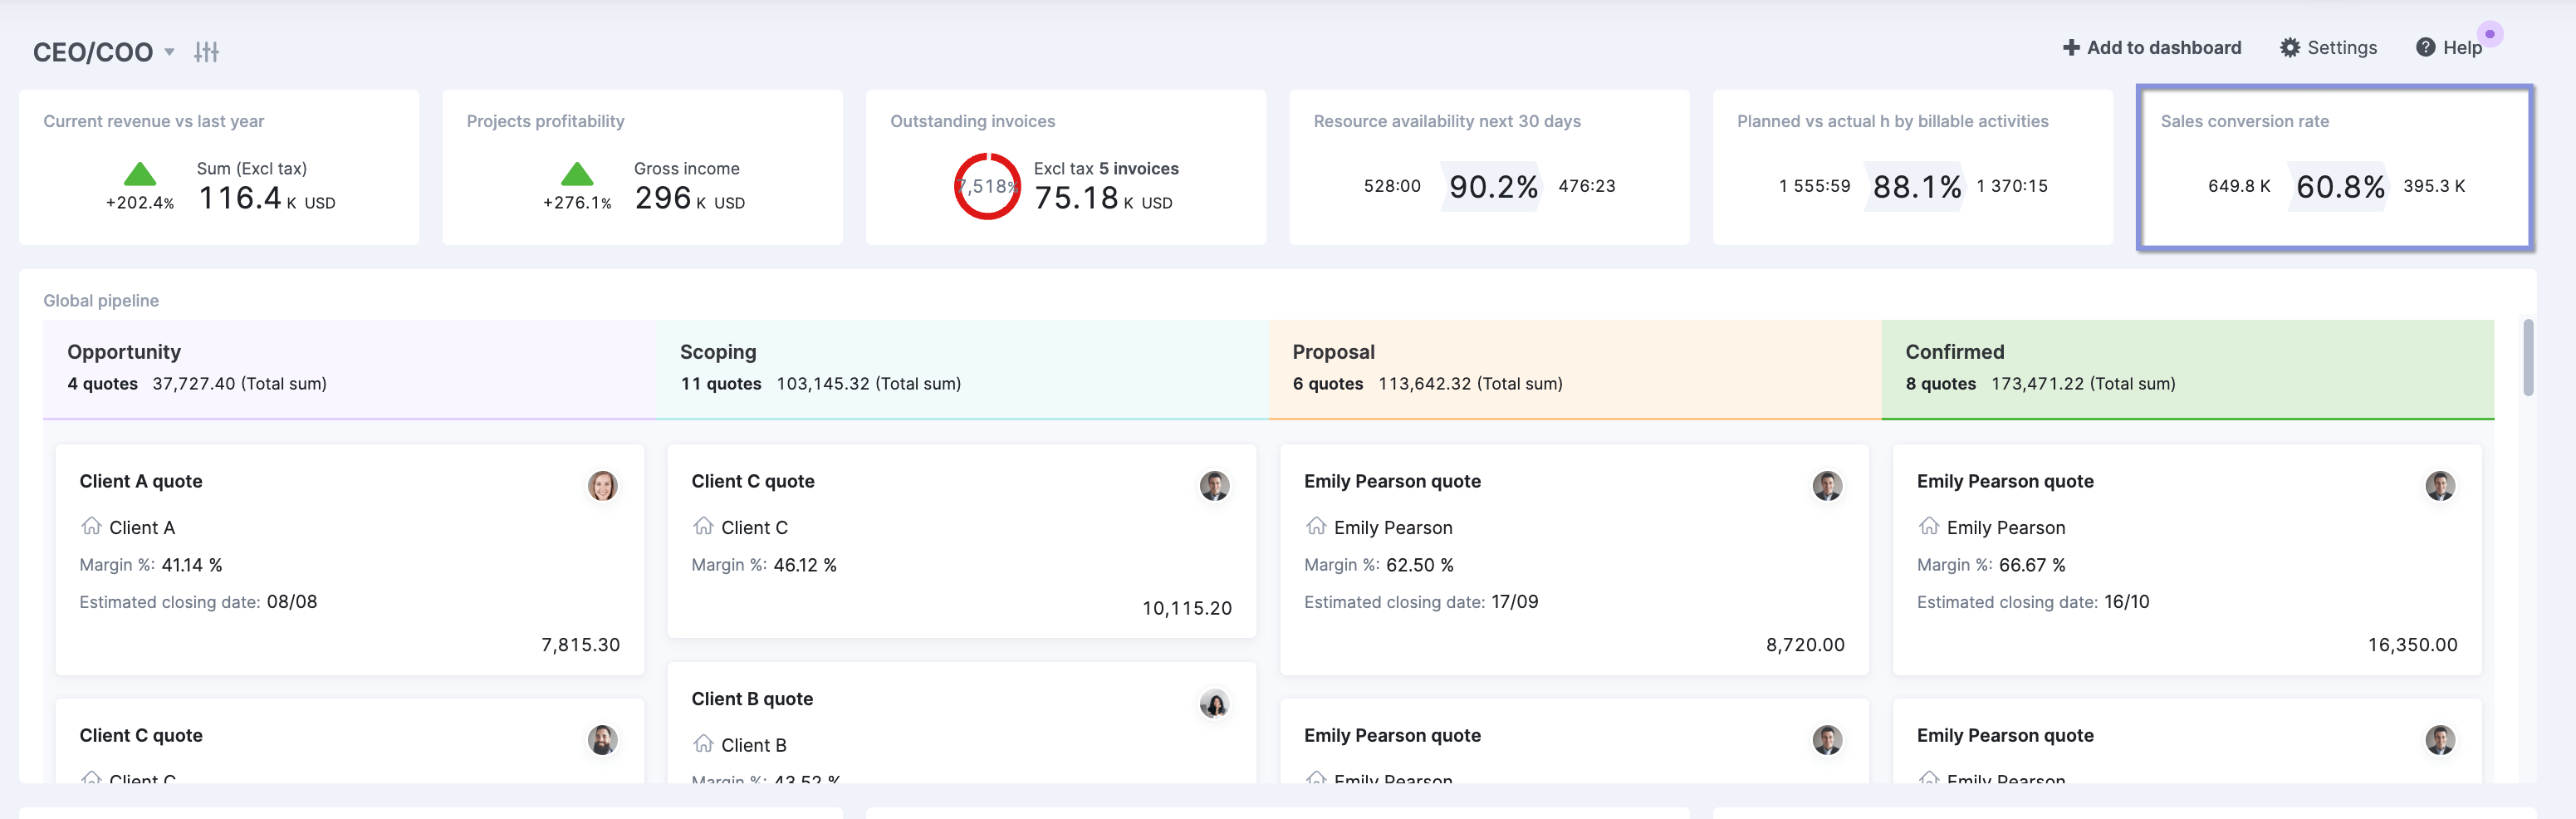
Scoro offers several ways to quickly track and analyze your total revenue. In fact, as soon as you log in, using the CEO/COO dashboard, you’ll immediately your current revenue to date vs last year:
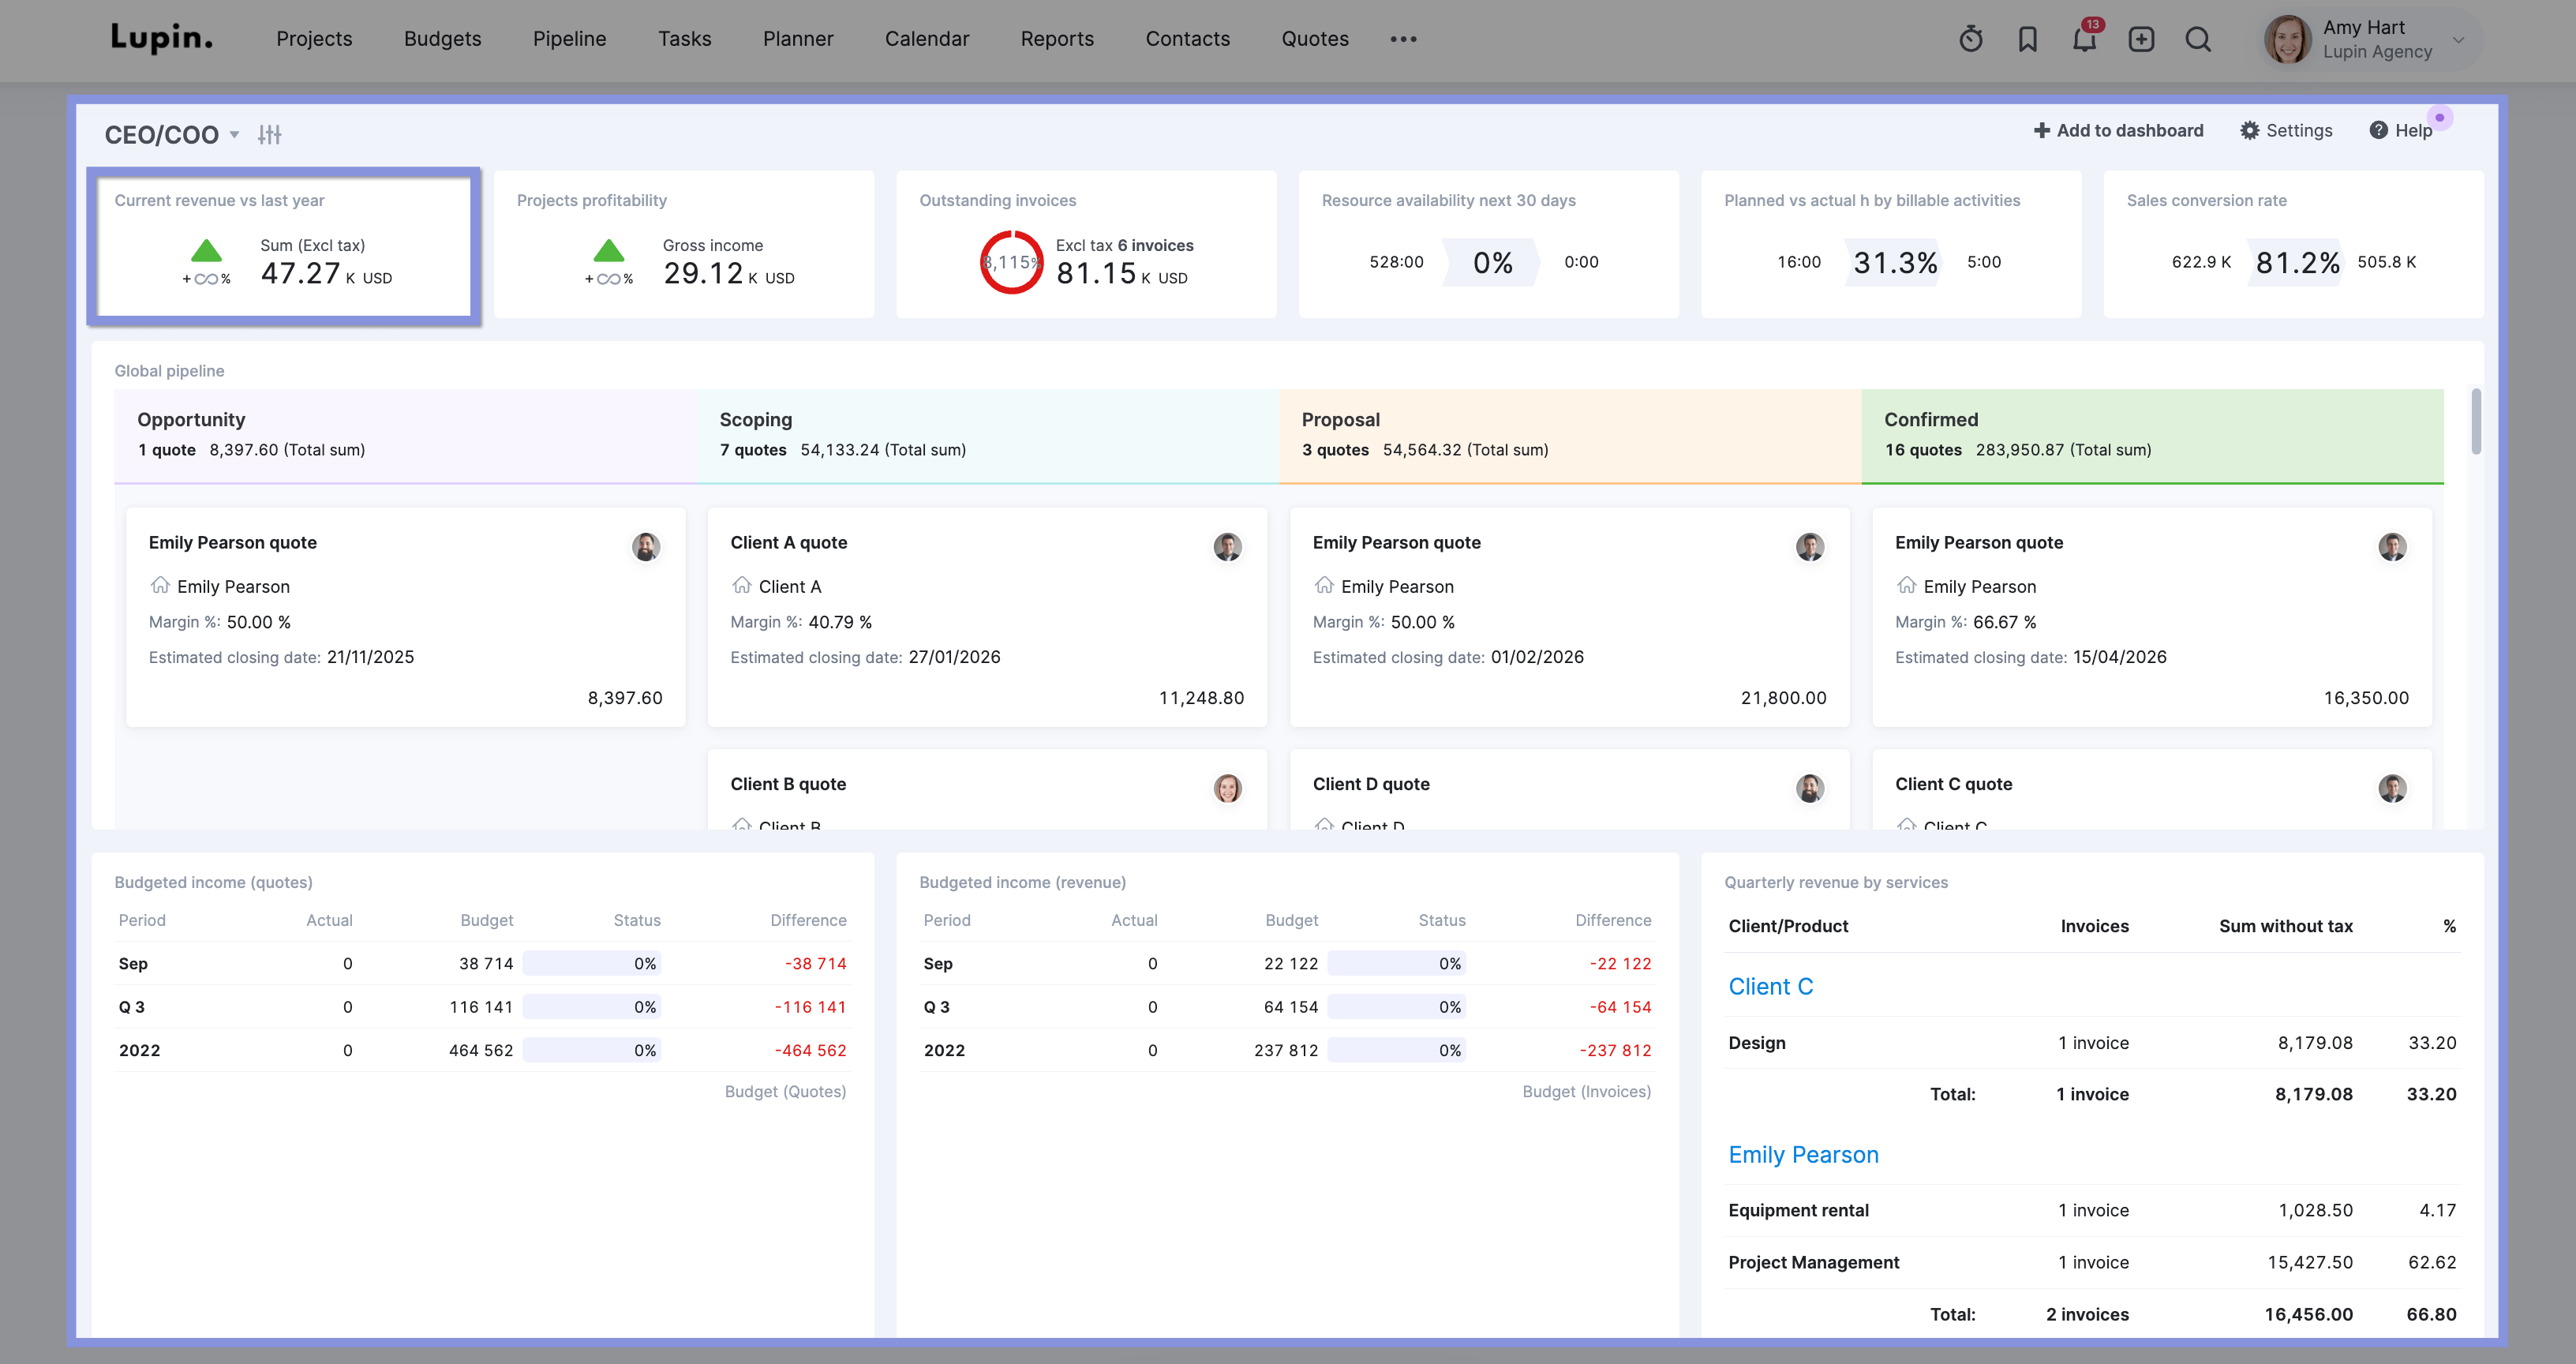
For a deeper revenue dive, use the “Revenue report.”
It shows your total revenue per month, so you can quickly see how revenue has evolved (and hopefully, grown) over time. Use different filters to zoom into specific projects, clients, or team members to review the impact on revenue performance.
2. Gross margin
Gross margin subtracts pass-through costs (like bills and expenses) from revenue. It tells you how efficiently your company converts revenue into profit. And it’s typically expressed as a percentage of your total revenue.
Example
Let’s say your consulting firm brought in $100,000 in revenue on an AI implementation project for a client.
But there was $60,000 in pass-through costs, including:
- Support from a third-party contractor: $50,000
- Specialized software licenses: $6,000
- Travel expenses for on-site workshops: $4,000
So, the gross margin for this project was 40% (calculated as: ($100,000 – $60,000) / $100,000 = 40%).
Why it matters
Gross margin tells you a lot about the true profitability of your projects and services.
For instance, you might realize a high-revenue project you were really excited about actually has a low gross margin. Or a seemingly low-value project might have a really high margin.
This insight helps you make better decisions on:
- Pricing strategies
- Expense management
- The kind of projects you take on
How to track it
To calculate gross margin, use this formula:
Gross Margin % = ((Total Revenue – Direct Costs) / Total Revenue) * 100
For a deeper analysis, create a list of all your projects. Include their revenues and direct costs. Then, calculate the gross margin for each project using the formula above.
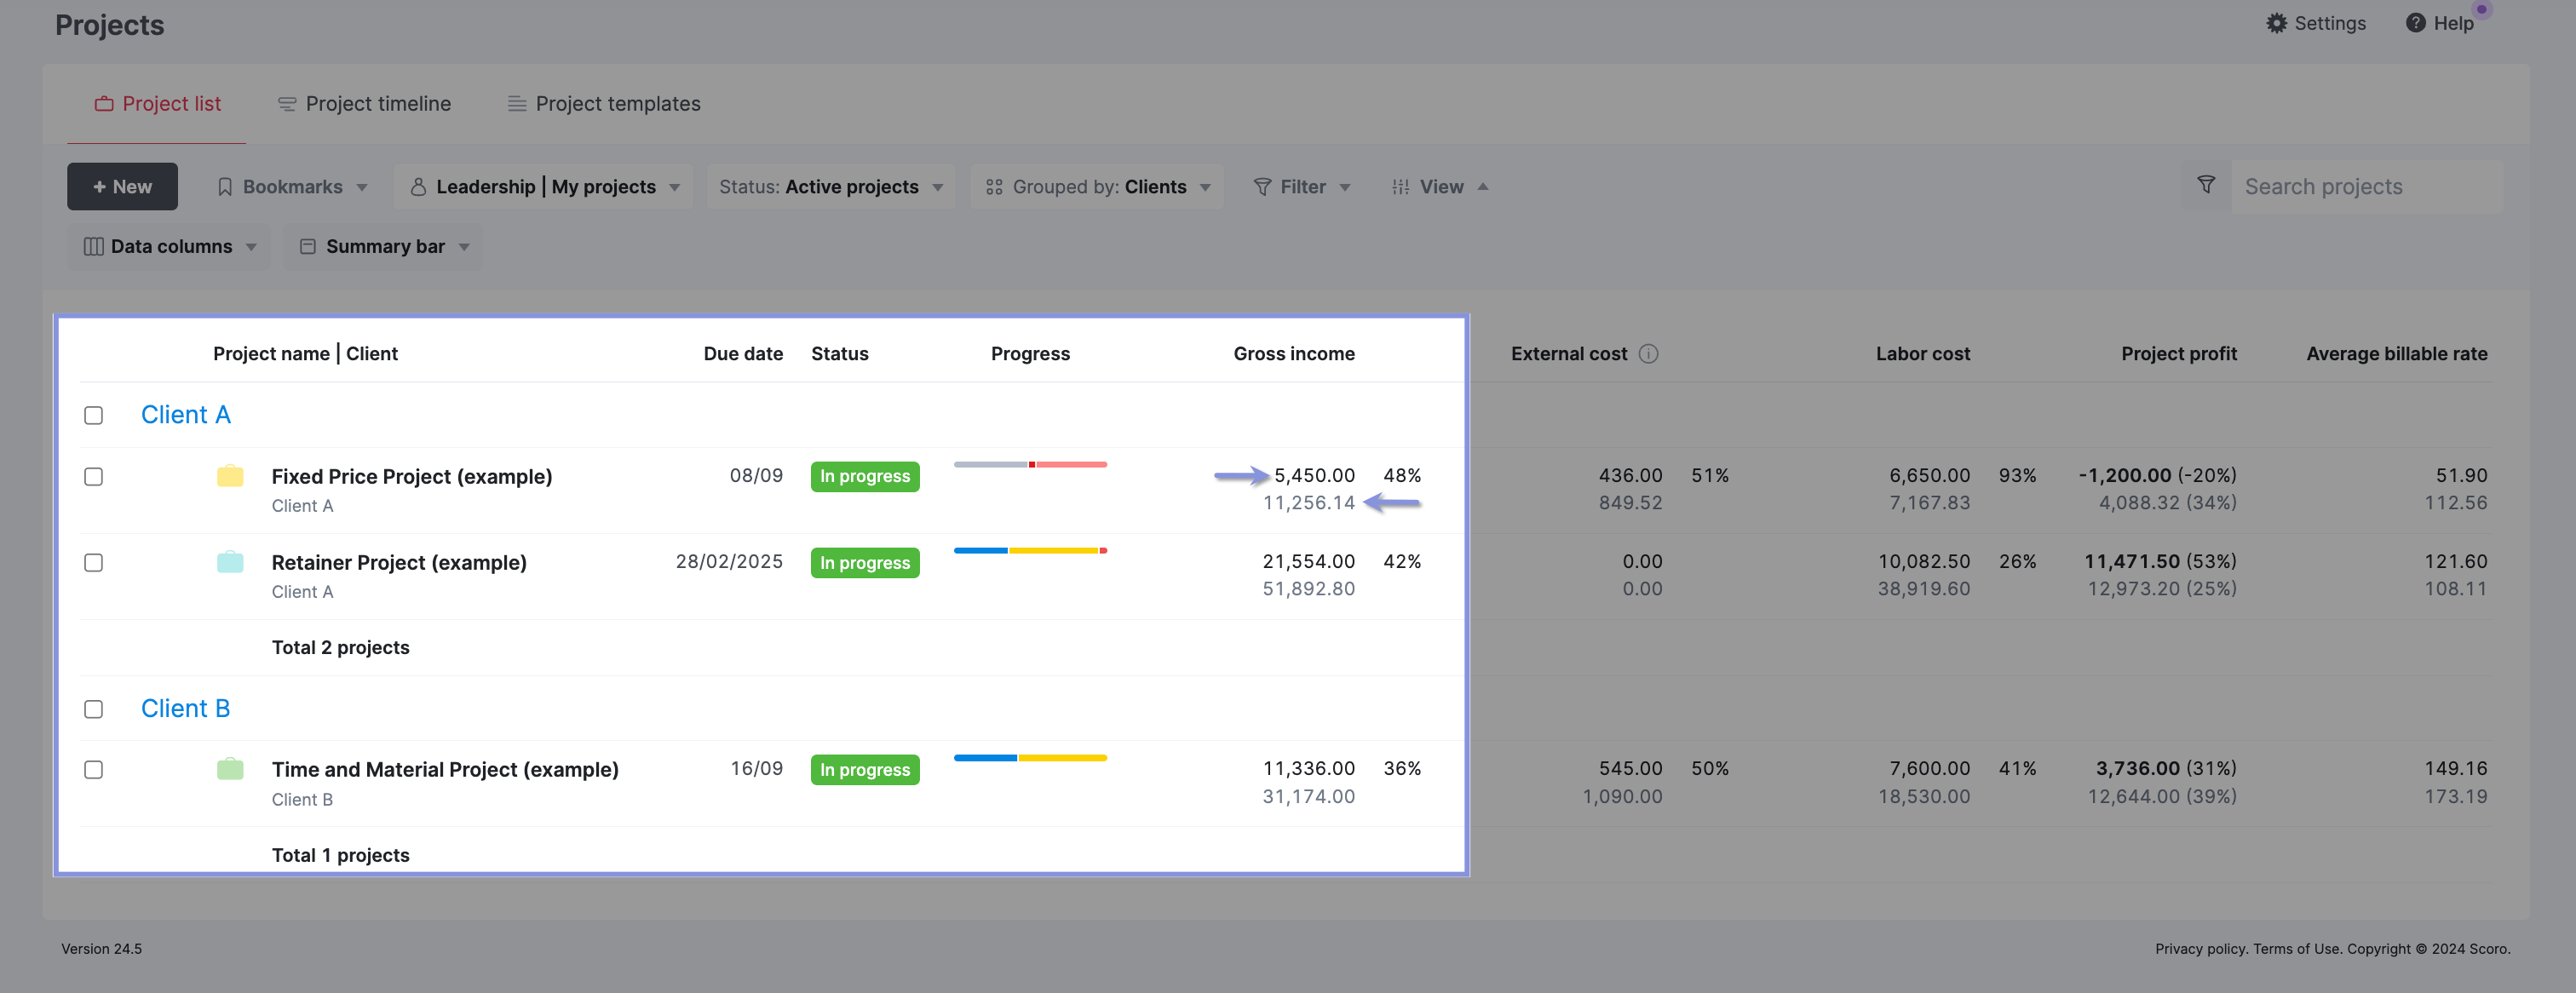
Or, with Scoro, you can skip doing the math yourself—it automatically calculates the gross margin for you.
Just open the “Projects” module and look at the “Gross income” column for each project. You’ll see the gross margin listed as a percentage.
3. Delivery margin
Delivery margin (or profit margin) shows how profitable your firm’s project delivery is. It’s the percentage of revenue that remains as profit after all direct costs. Unlike gross margin, it also factors in labor.
Example
Say your consulting firm completed three projects this quarter: a digital transformation initiative, a strategy consulting engagement, and a smaller process optimization project.
In total, your firm earned $200,000 in revenue across these three projects. The combined pass-through costs were $80,000. And total labor costs were $40,000.
This leaves a profit of $80,000 and a 40% delivery margin (calculated as: ($200,000 – $80,000 – $40,000) / $200,000 = 40%).
Why it matters
Your delivery margin gives you a holistic view of your firm’s profitability, including labor costs. Unlike your gross margin, it factors in the actual time and effort your team spends on projects. This big-picture view helps you:
- Gauge how you’re managing labor costs, bills, and expenses as a whole
- Determine if there are any project outliers driving your delivery margin up or down
- Identify areas where you can reduce costs and boost profits, such as outsourcing, adjusting pricing, or consolidating your tech stack
How to track it
Work out the total revenue from all projects for a given period. Next, add up all labor costs, bills, and expenses. Then, calculate the profit. And apply this formula:
Delivery Margin = (Total Profit / Total Revenue) * 100
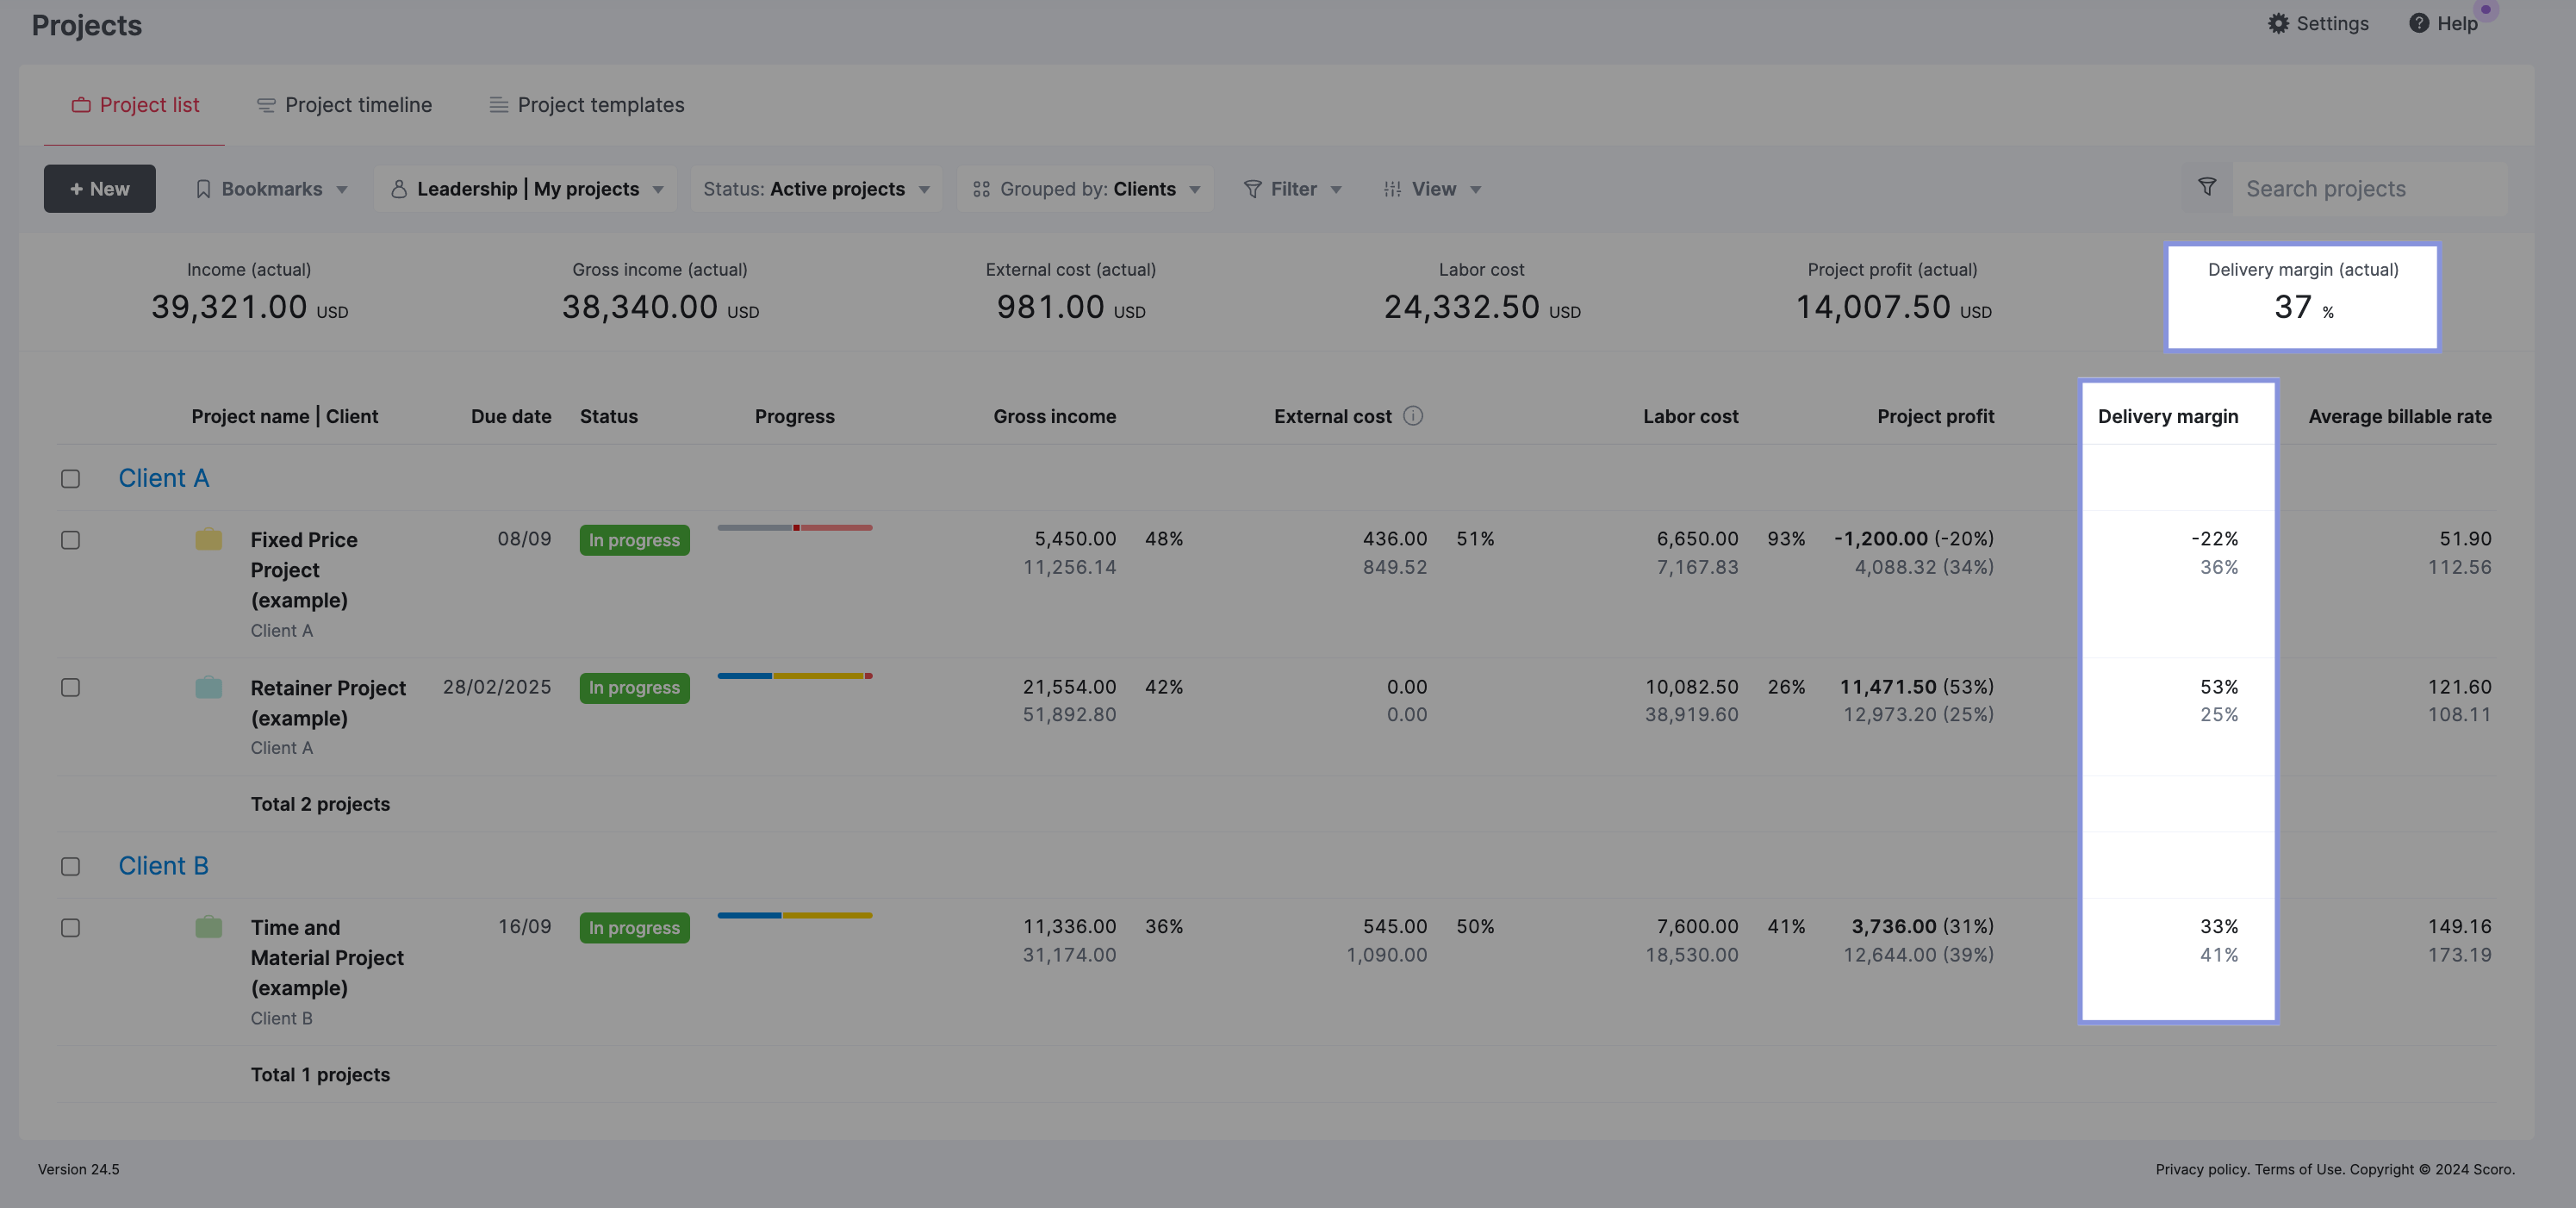
Or use Scoro, which automatically calculates your delivery margin for you.
Open the “Projects” tab. Then, click the “Summary bar” button and check “Delivery margin.” You’ll see the overall delivery margin at the top under “Delivery margin (actual).”
4. Net margin
Net margin is the percentage of your consultancy’s revenue that remains as profit after factoring in all business costs: pass-through, labor, and overhead costs like rent, utilities and admin salaries.
Example
Let’s say your consulting firm generated $500,000 in revenue last quarter. Your pass-through costs and labor costs came to $350,000. Your overhead costs came to $100,000.
So, after accounting for all these costs, your firm retained 10% of its revenue as profit (calculated as: ($500,000 – $350,000 – $100,000) / $500,000 = 10%).
Why it matters
Net margin provides the most complete view of your firm’s profitability. Unlike gross margin or delivery margin, net margin considers all your costs, including overhead.
This comprehensive view allows you to:
- Understand your true bottom line after all costs
- Spot areas where overhead costs might be eating into profits
- Align your project decisions with a greater overall business strategy
- Decide if your org needs to adjust pricing or cut expenses
How to track it
The formula to calculate net profit is:
Net Profit = Delivery Profit – Overhead Costs
Your overhead costs include things like:
- Office rent
- Utilities
- Admin salaries
- Software subscriptions
Scoro integrates with accounting software like Xero and QuickBooks. So, you can easily access these numbers without needing to ask around.
5. Forecasted revenue
Forecasted revenue is the amount of revenue you expect to earn over the coming months. This is based on your current pipeline, backlog, and market conditions.
Example
Imagine your consulting firm is forecasting revenue for the next quarter. You have:
- A current $60,000 project, with $20,000 to be billed each month for the next three months
- A new $45,000 project starting next month, to be billed equally over three months
- A potential $30,000 project in your pipeline, with a 50% chance of closing in the third month
Your forecasted revenue might look like this:
- Month One: $20,000 (from current project)
- Month Two: $35,000 ($20,000 from current project + $15,000 from new project)
- Month Three: $50,000 ($20,000 from current project + $15,000 from new project + $15,000 from potential project, adjusted for 50% probability)
This forecast gives you an idea of how much revenue you can expect to bring in over the next quarter.
Why it matters
Forecasted revenue helps you predict your company’s financial health. It lets you answer questions like:
- Do we have enough projects lined up?
- Are we on track to reach our growth targets?
- Do we have enough staff to handle our project queue?
- Is our cash flow okay?
With this foresight, you can recommend timely adjustments—like outsourcing, reducing headcount, or working with your sales team to bring in more work—to ensure your firm stays in the black.
How to track it
Calculating forecasted revenue involves considering:
- Quoted projects you haven’t started yet (potential future revenue)
- Ongoing projects you’re currently working on (active revenue)
Using the quoted revenue amounts from deals in your Scoro pipeline, the platform can automatically create revenue forecasts for you in seconds.
Once you officially convert those deals to projects, Scoro automatically updates the forecast based on your budget, tasks, and time entries to make the predictions more accurate.
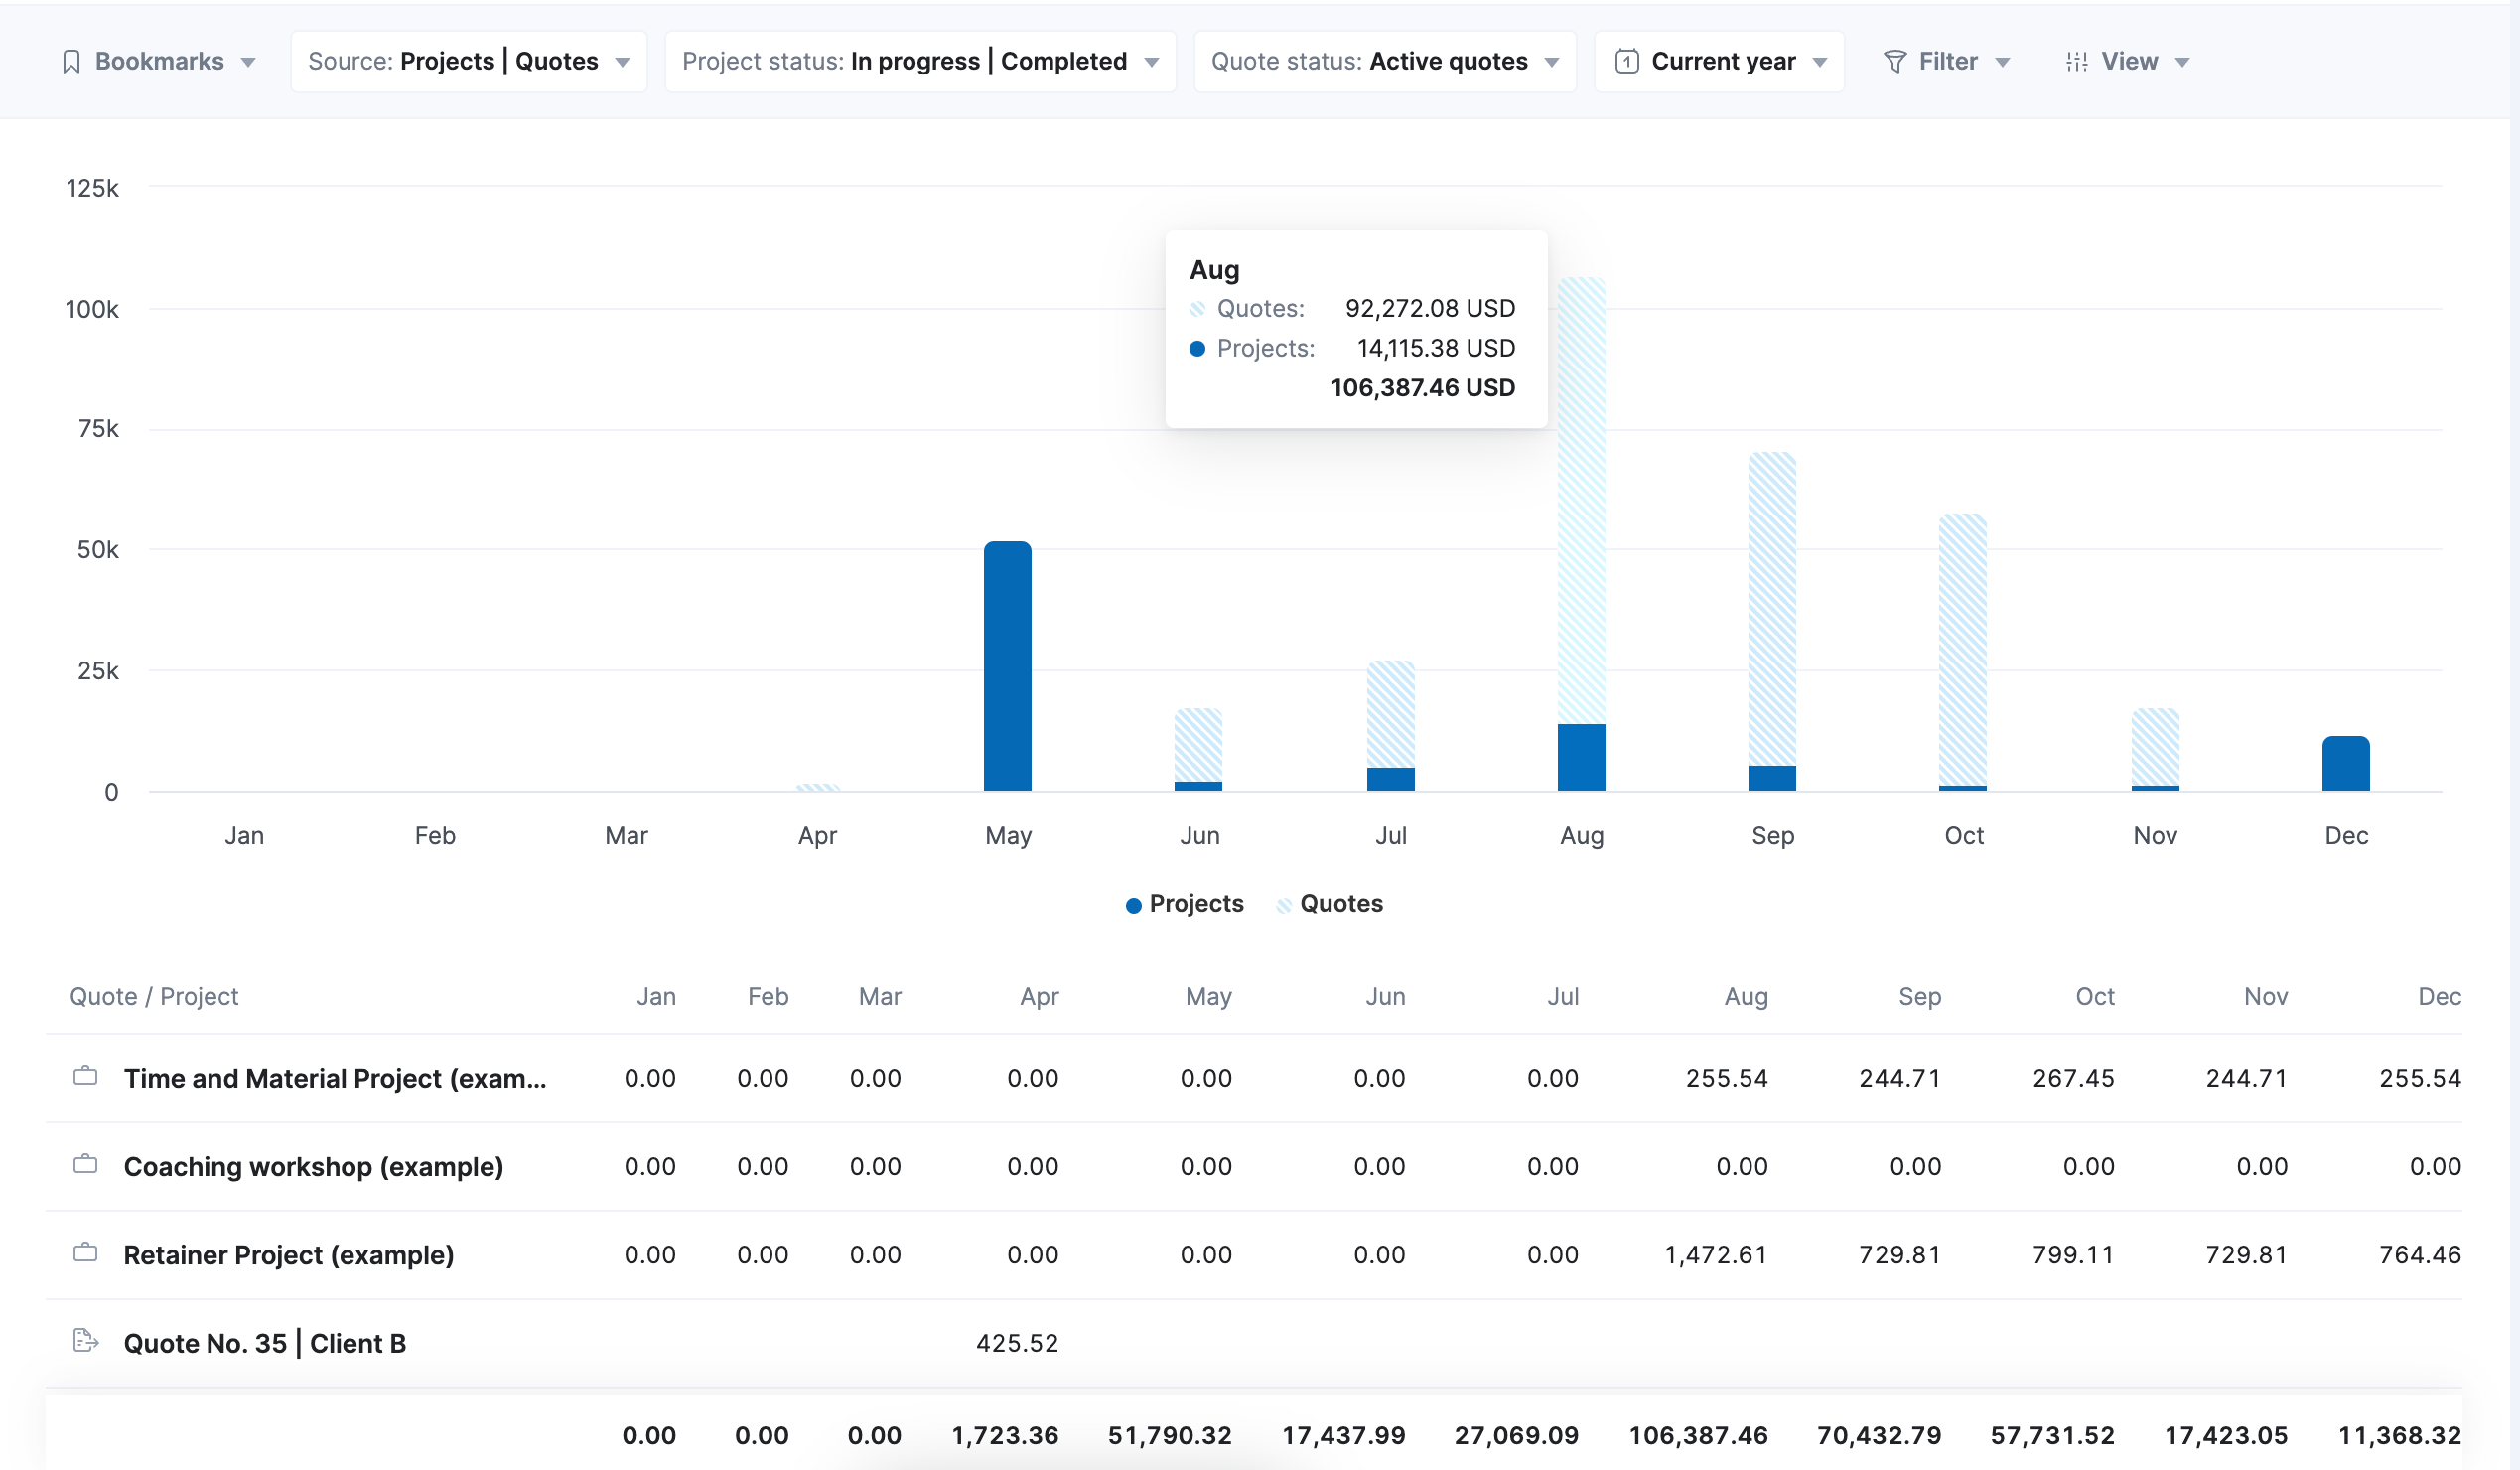
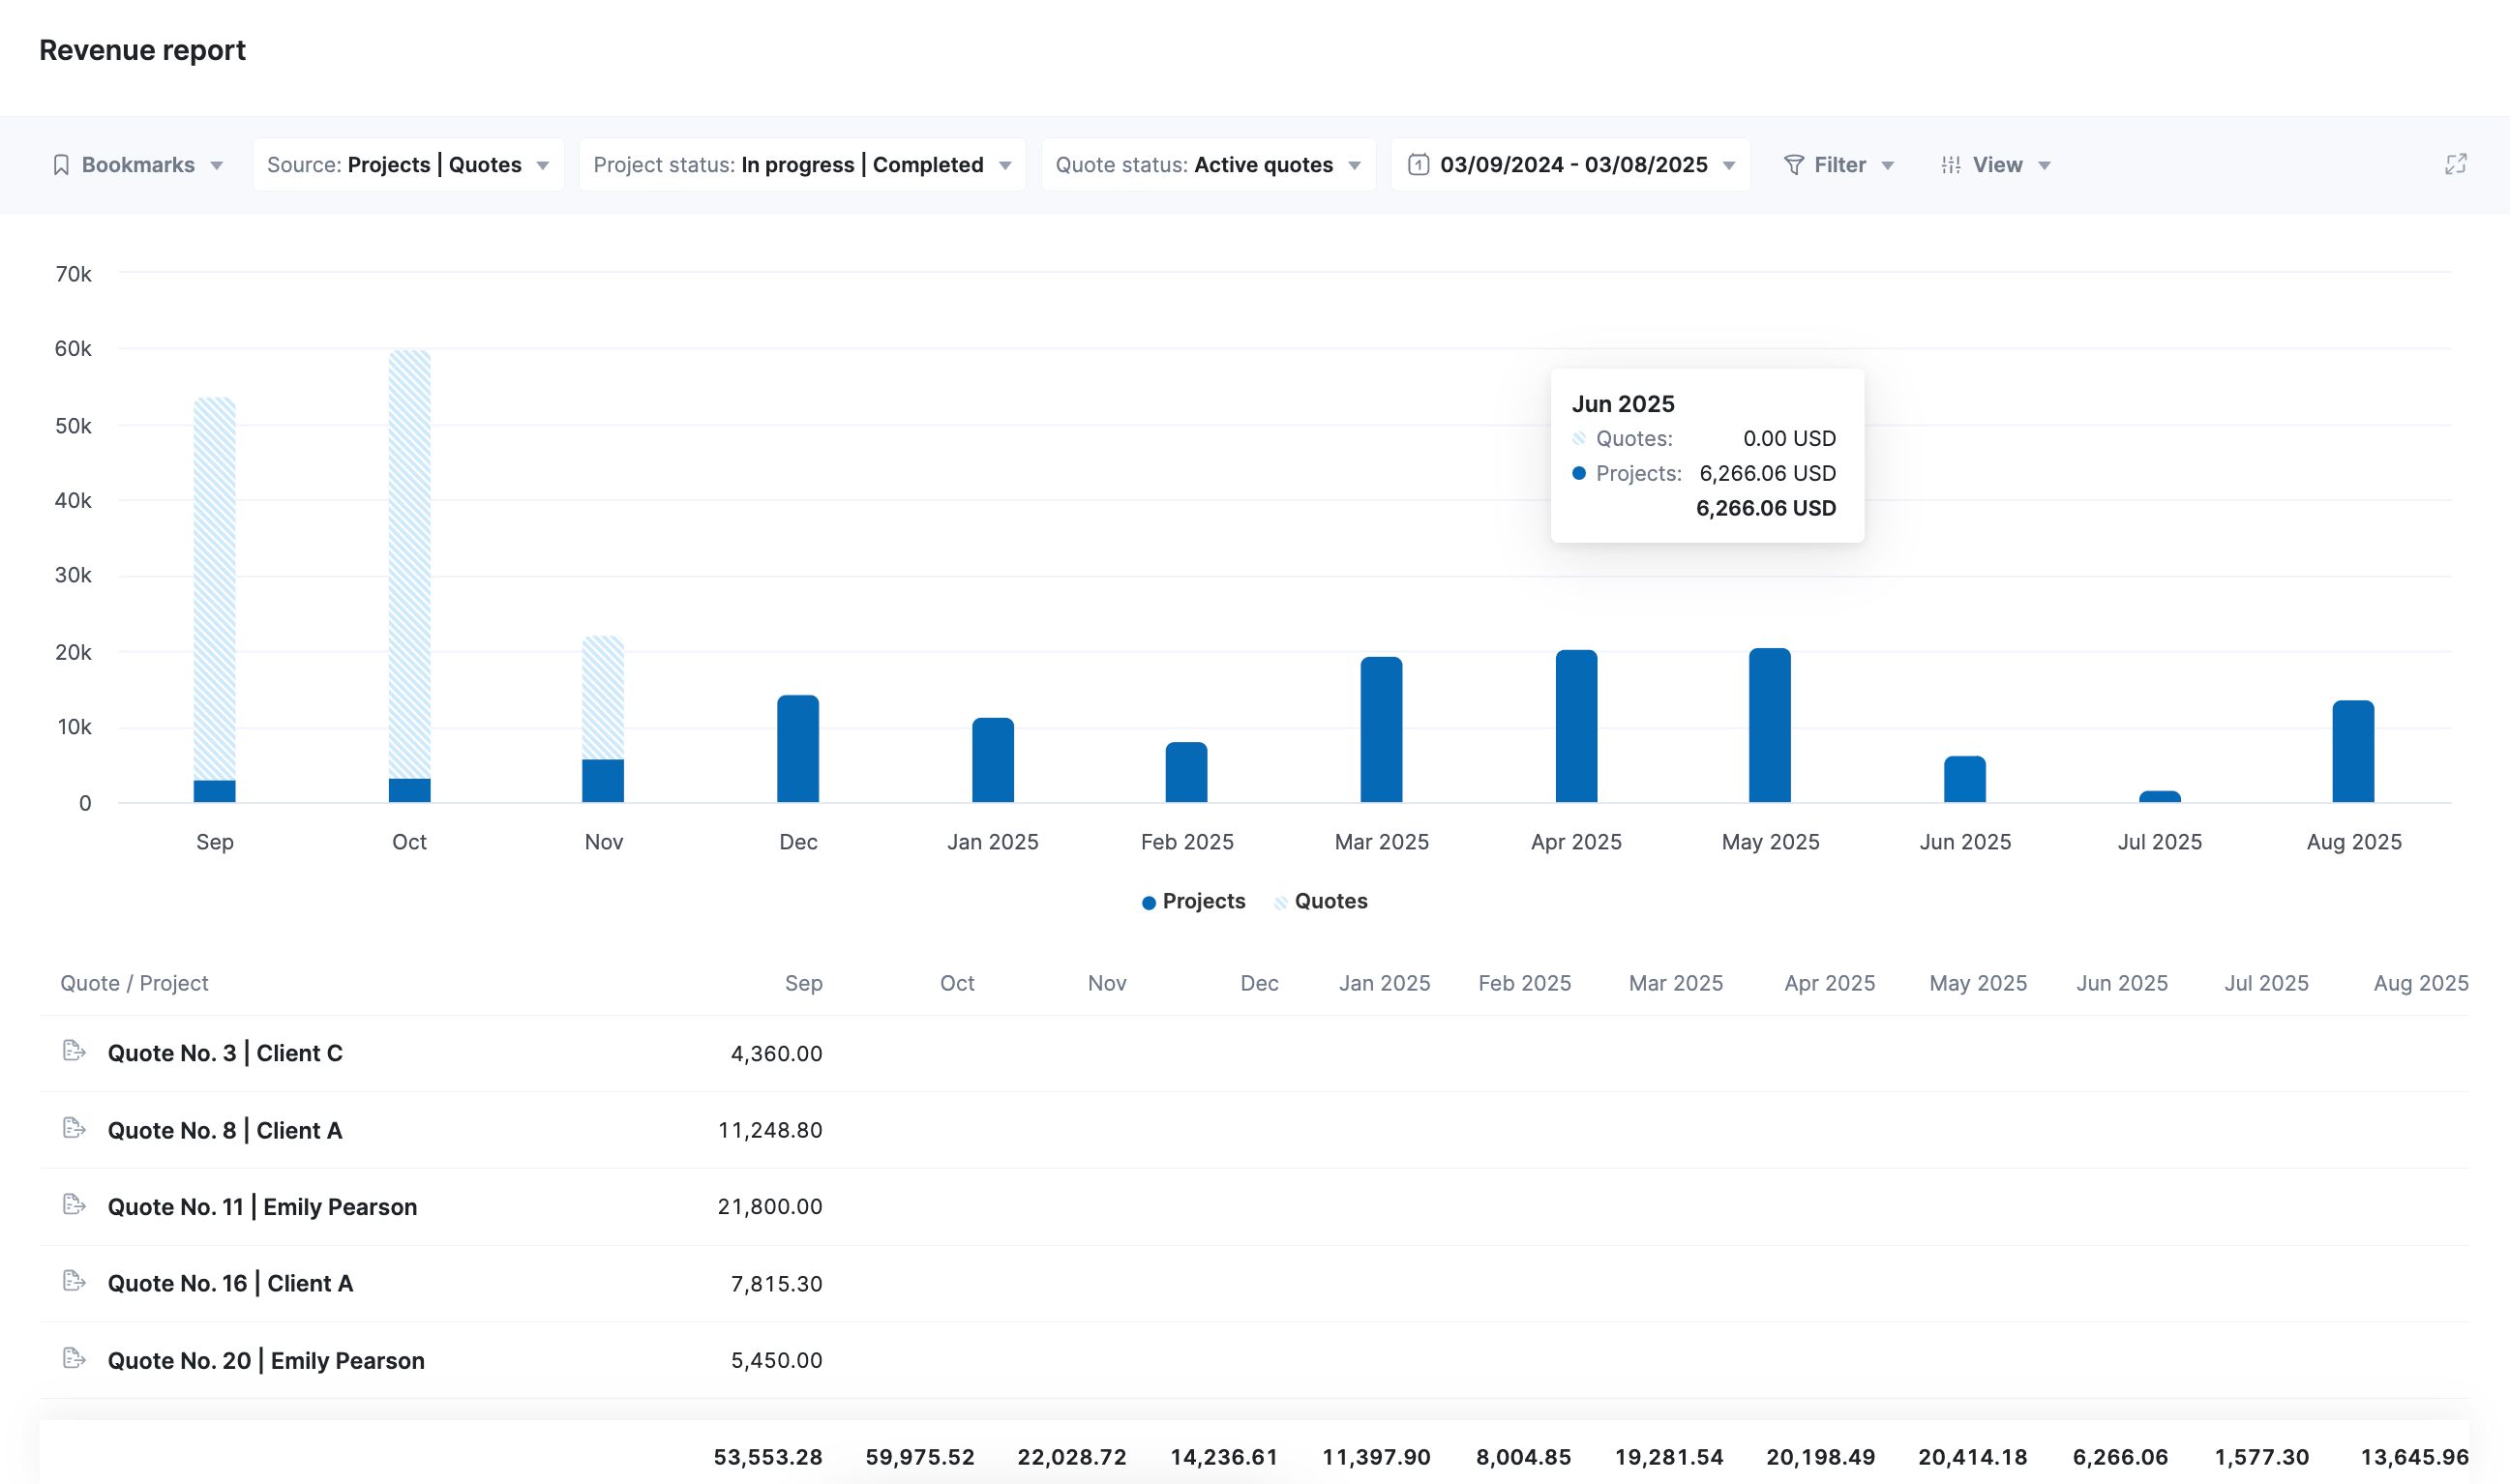
To see your revenue forecast, open Scoro’s “Revenue Report.” Then, select “Next 12 months” from the date picker.
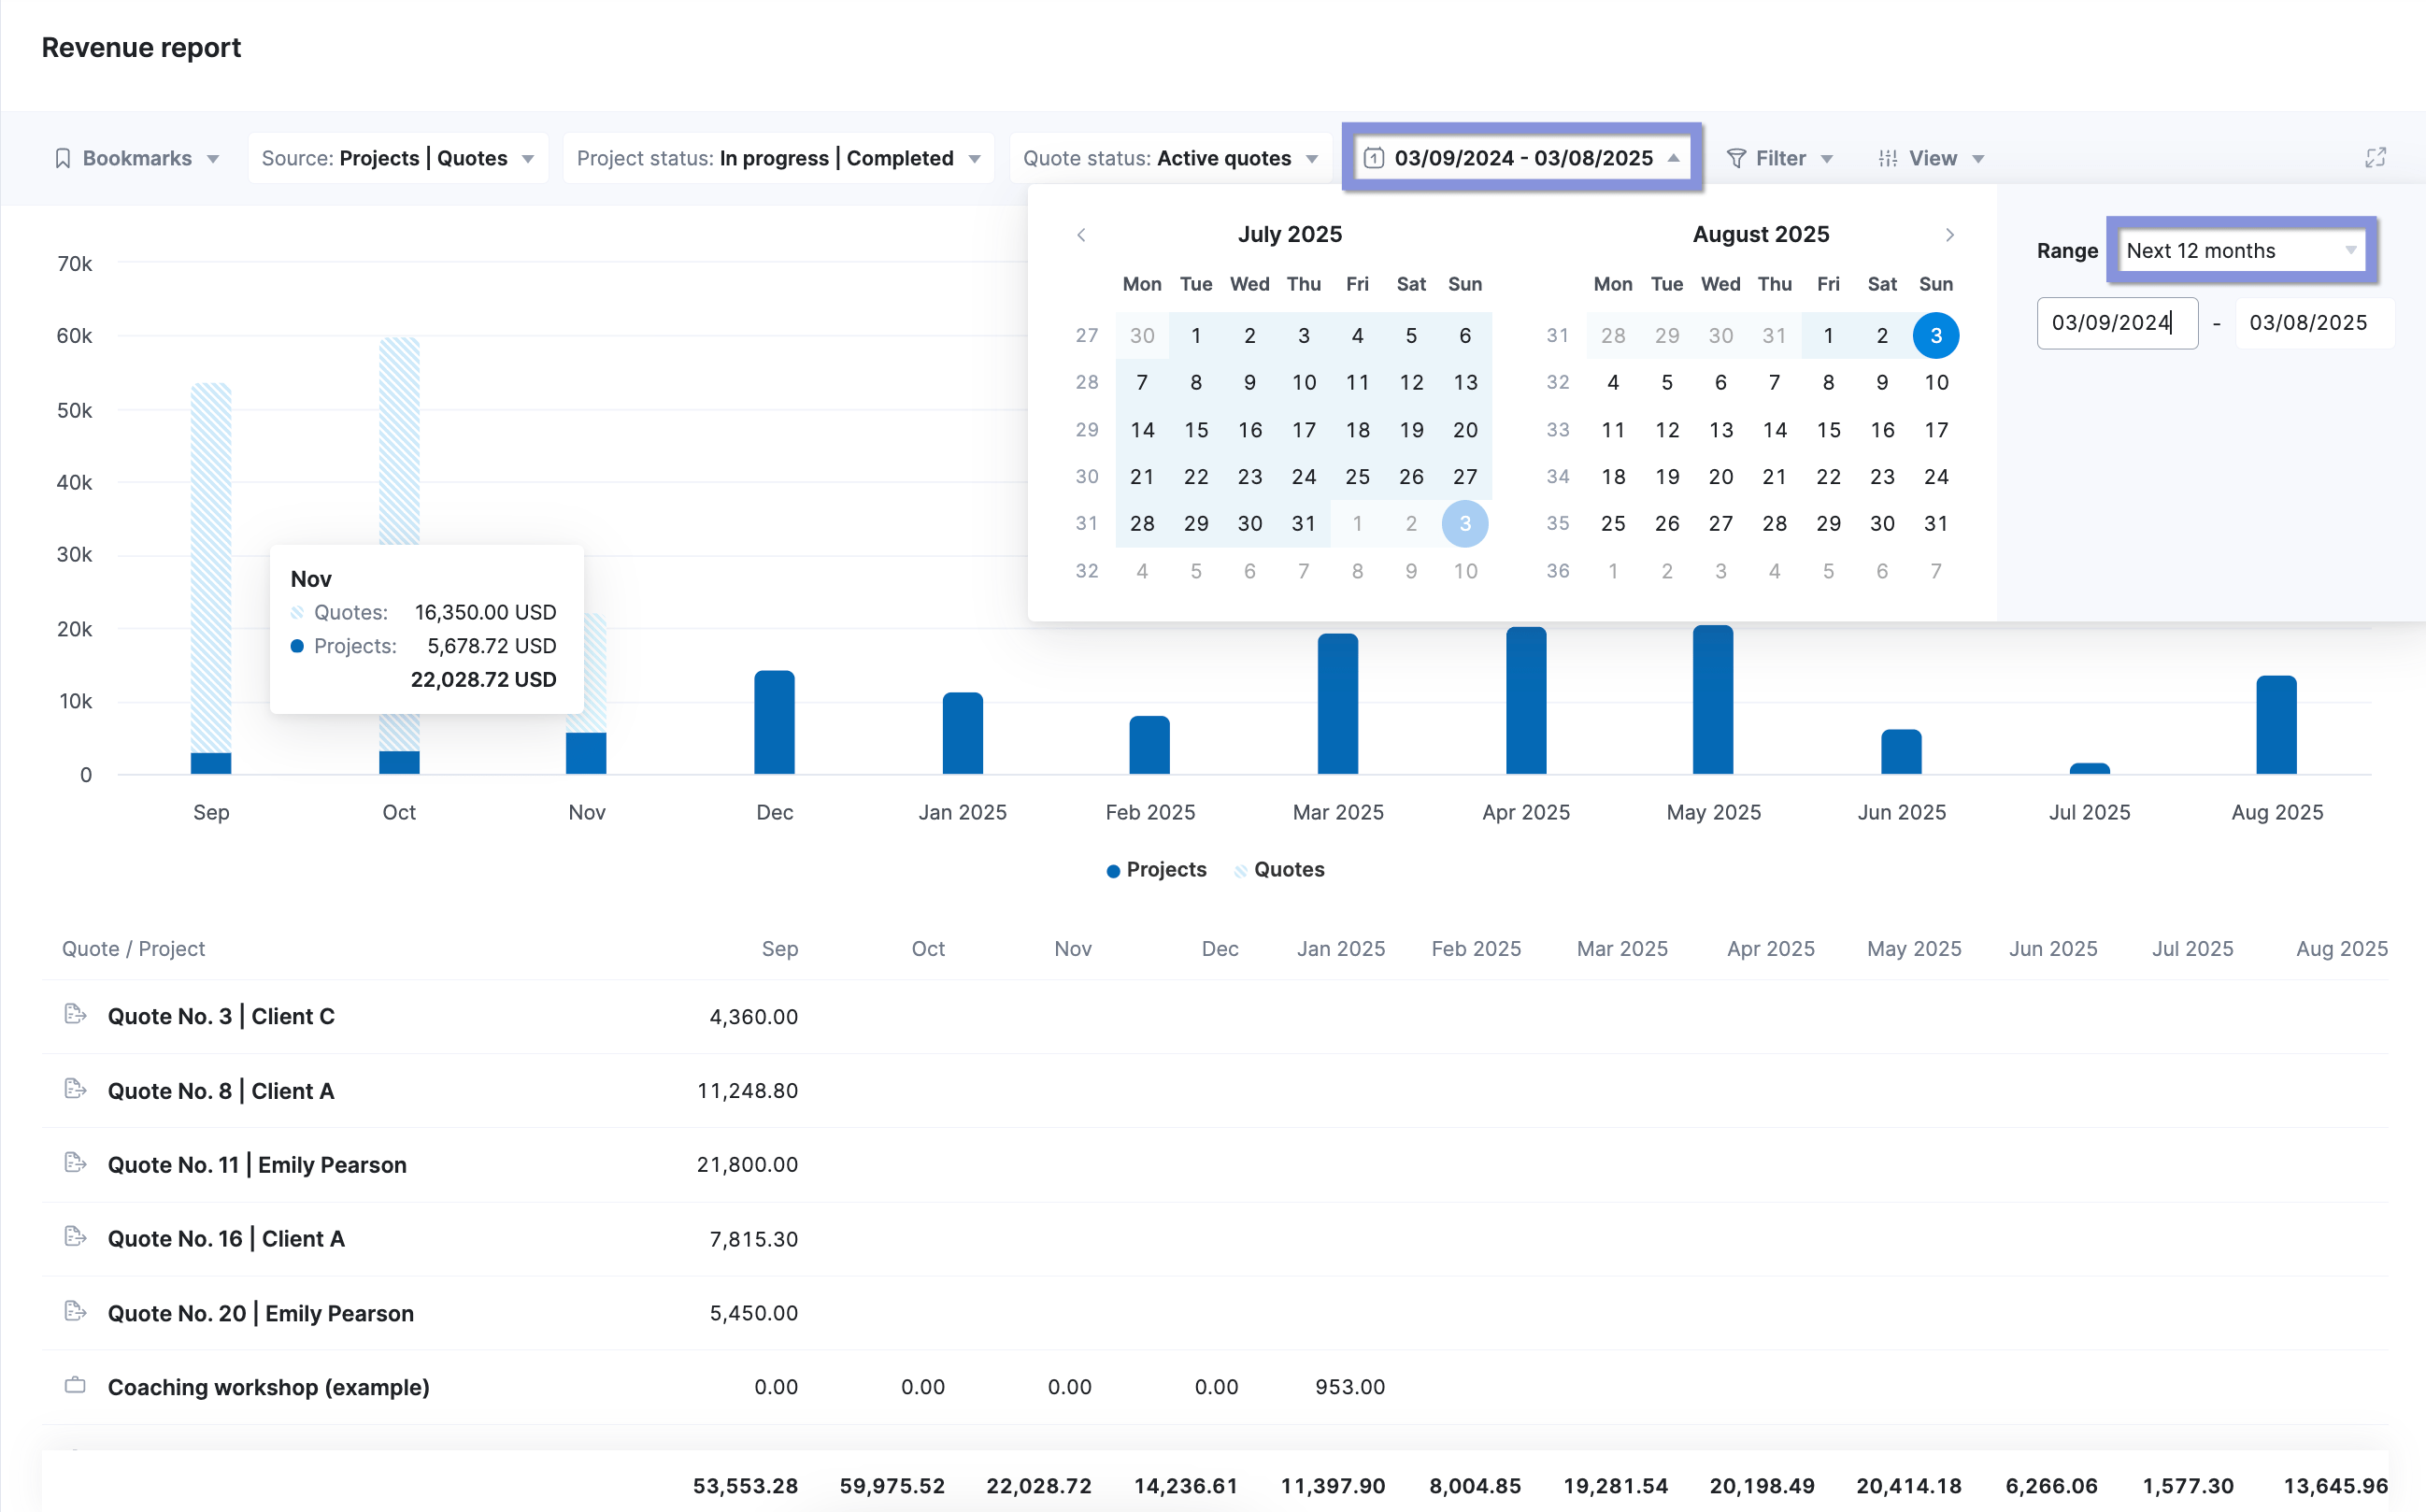
You’ll see a breakdown of your expected revenue for the next 12 months:
Top Tip
Check out our help center video to learn more about revenue forecasting in Scoro.
6. Billable utilization rate
Billable utilization rate measures the percentage of a consultant’s total available time spent on revenue-generating work.
This is different from resource utilization rate, which considers time spent on revenue-generating work AND tasks that don’t directly bring in money (internal meetings, admin, etc.)
You can calculate billable utilization by:
- Multiplying the result by 100 to express it as a percentage
- Dividing the total number of billable hours by the total number of available hours
As a general rule, a consulting firm should focus more on billable utilization. Billable hours directly generate revenue and contribute to the firm’s profitability.
Aim for a billable utilization rate of 75% to 80%.
This target ensures that your team spends most of its time on revenue-generating work but still gives them time for breaks and necessary activities like meetings, admin work, and professional development.
Example
A consultant has 40 available working hours per week.
They spend:
- 30 hours on billable client work
- 5 hours on internal meetings and administrative tasks
- 3 hours on professional development
So, this consultant’s billable utilization rate is 75% (30 hours out of 40). And 20% of their time is spent on necessary non-billable work, with 5% remaining for breaks and personal time.
Why it matters
Billable utilization rates show how much of your consultants’ time directly contributes to bringing in revenue. You can use this information to maximize revenue-generating potential while still maintaining a balanced workload for your team.
Tracking these rates also lets you:
- Spot opportunities to increase billable hours
- Make informed decisions about capacity planning and resource planning
- Reduce costly burnout and disengagement
- Set realistic targets for consultants and objectively measure their performance
How to track it
First, you’ll need to determine the total available working hours.
Then, your consultants need to use a time tracking system to track their time spent on billable and non-billable work activities.
Once you have this info, divide the total billable hours by available hours. And multiply by 100.
Billable Utilization Rate (%) = (Total Billable Hours / Total Available Hours) x 100
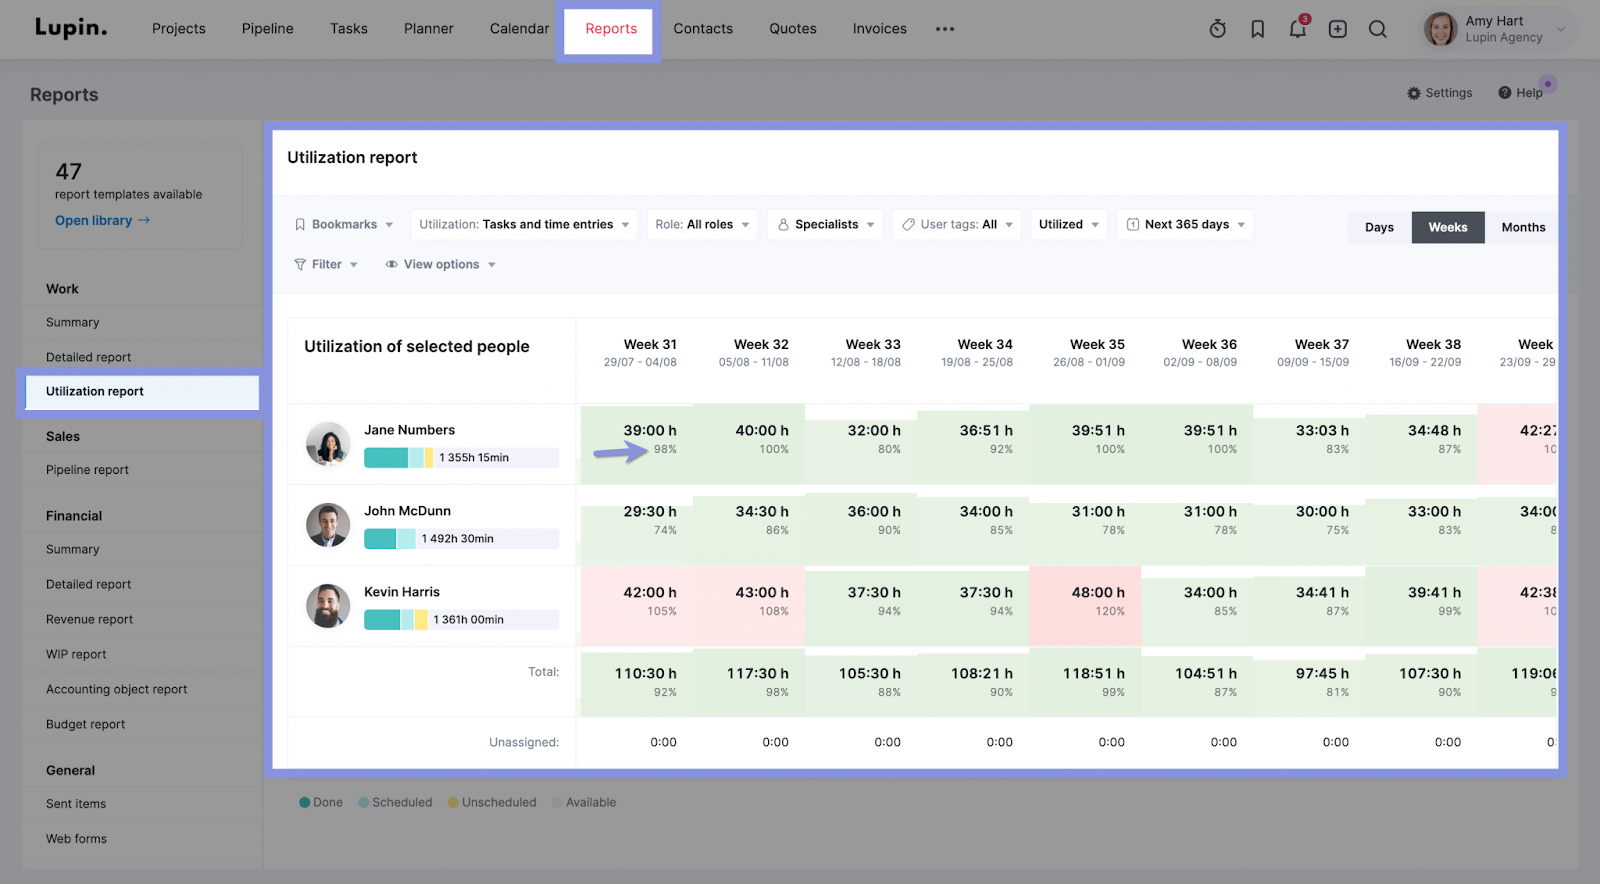
With Scoro, you can see your team’s billable utilization straight away using the “Utilization report”—no calculations needed.
The report initially shows resource utilization, which includes both billable and non-billable hours. This is a broader look at how busy your team is overall.
If a team member is overutilized, you’ll see a red box. And you can quickly take action to get them back to a balanced (green) workload.
To see the billable utilization rate specifically, you need to adjust the report’s filters. This isolates the time spent on tasks that directly generate revenue.
Look for options to filter the data displayed in the report.
Select filters that focus on:
- Billable activity types: These are the categories you previously set up in Scoro’s settings to designate work that is charged to clients
- Billable tasks: You might also be able to filter by specific tasks that have been marked as billable
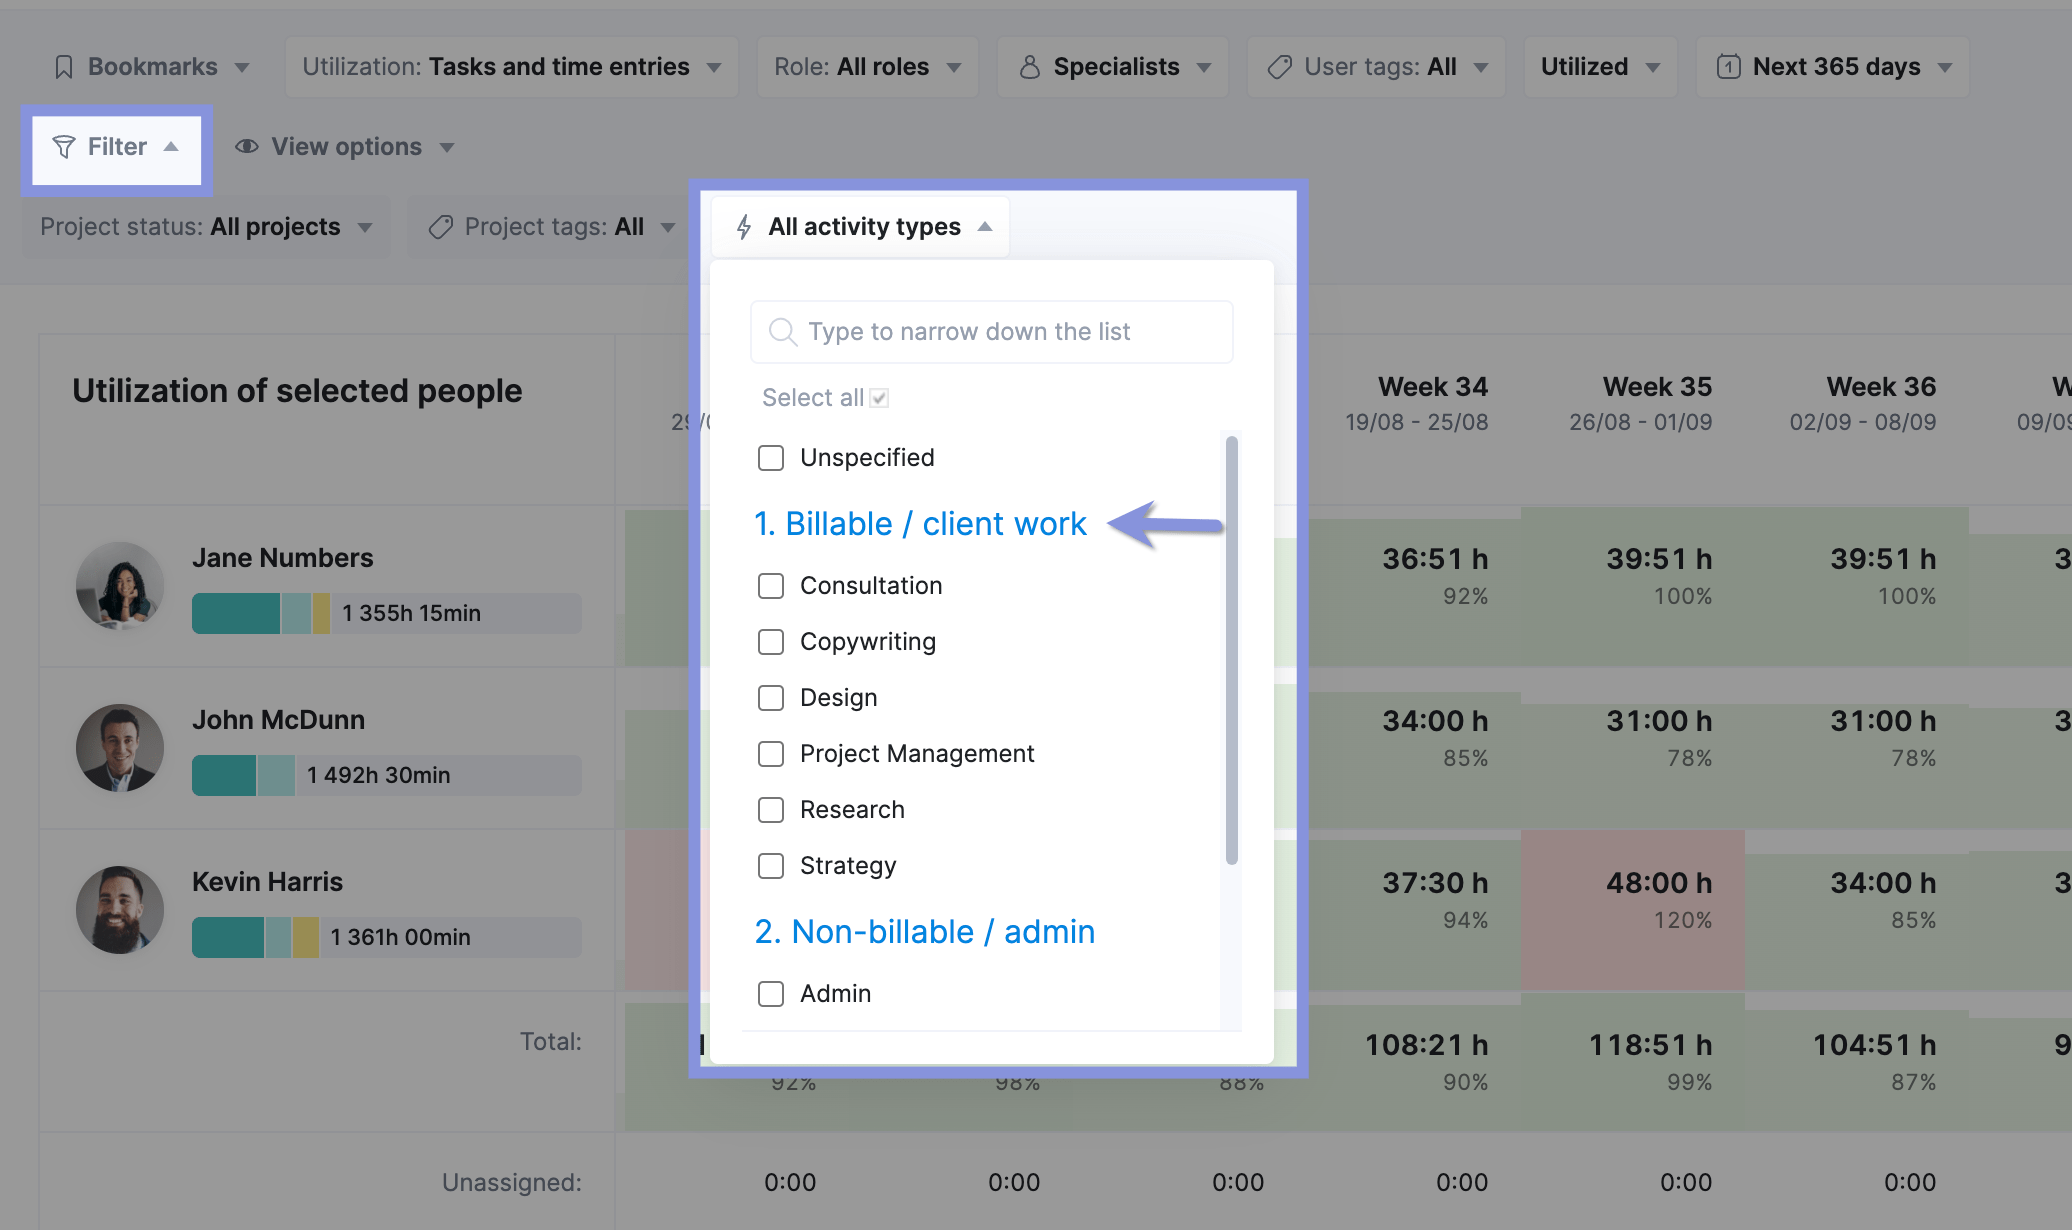
The report will now show you the billable utilization rate for your team members.
You’ll still see the color-coded indicators (red for overutilization, green for balanced) but they’ll now be based solely on billable work.
Top Tip
We recommend checking out our help center article on activity types to learn more about setting them up in Scoro.
7. Sales conversion rate
Sales conversion rate is the percentage of leads that successfully convert into paying clients.
You can use the following formula to calculate the conversion rate:
Sales Conversion Rate = (Number of Deals Won) / (Number of Total Deals) x 100
Where:
- Number of Deals Won = The deals that successfully closed/converted to sales over a given period.
- Number of Total Deals = The total count of deals that either won or lost/did not convert over that same period.
Example
If your consulting firm had 100 leads in the last quarter—and 20 of them became paying clients—your sales conversion rate would be 20%.
Why it matters
Sales conversion rate shows how effective the sales process and team is. If the conversion rate is low, it’s a clear sign to review and refine the sales approach. Like how the sales team handles nurturing and closing strategies. Or who they’re targeting.
This metric also helps you:
- Forecast revenue more accurately
- Judge the quality of leads
- Figure out where to allocate sales and marketing resources
How to track it
Divide the number of new clients by the total number of leads in a given period. Then, multiply by 100 to get the percentage.
Sales Conversion Rate = (Number of Deals Won) / (Number of Total Deals) x 100
In Scoro, you can track your conversion rate by adding the “Ratio metric” to your “Sales dashboard” to easily calculate this value based on issued quotes with successful deals.
To do this, you’ll go to your dashboard and click “Add to dashboard.” Then, click “Ratio metric.”
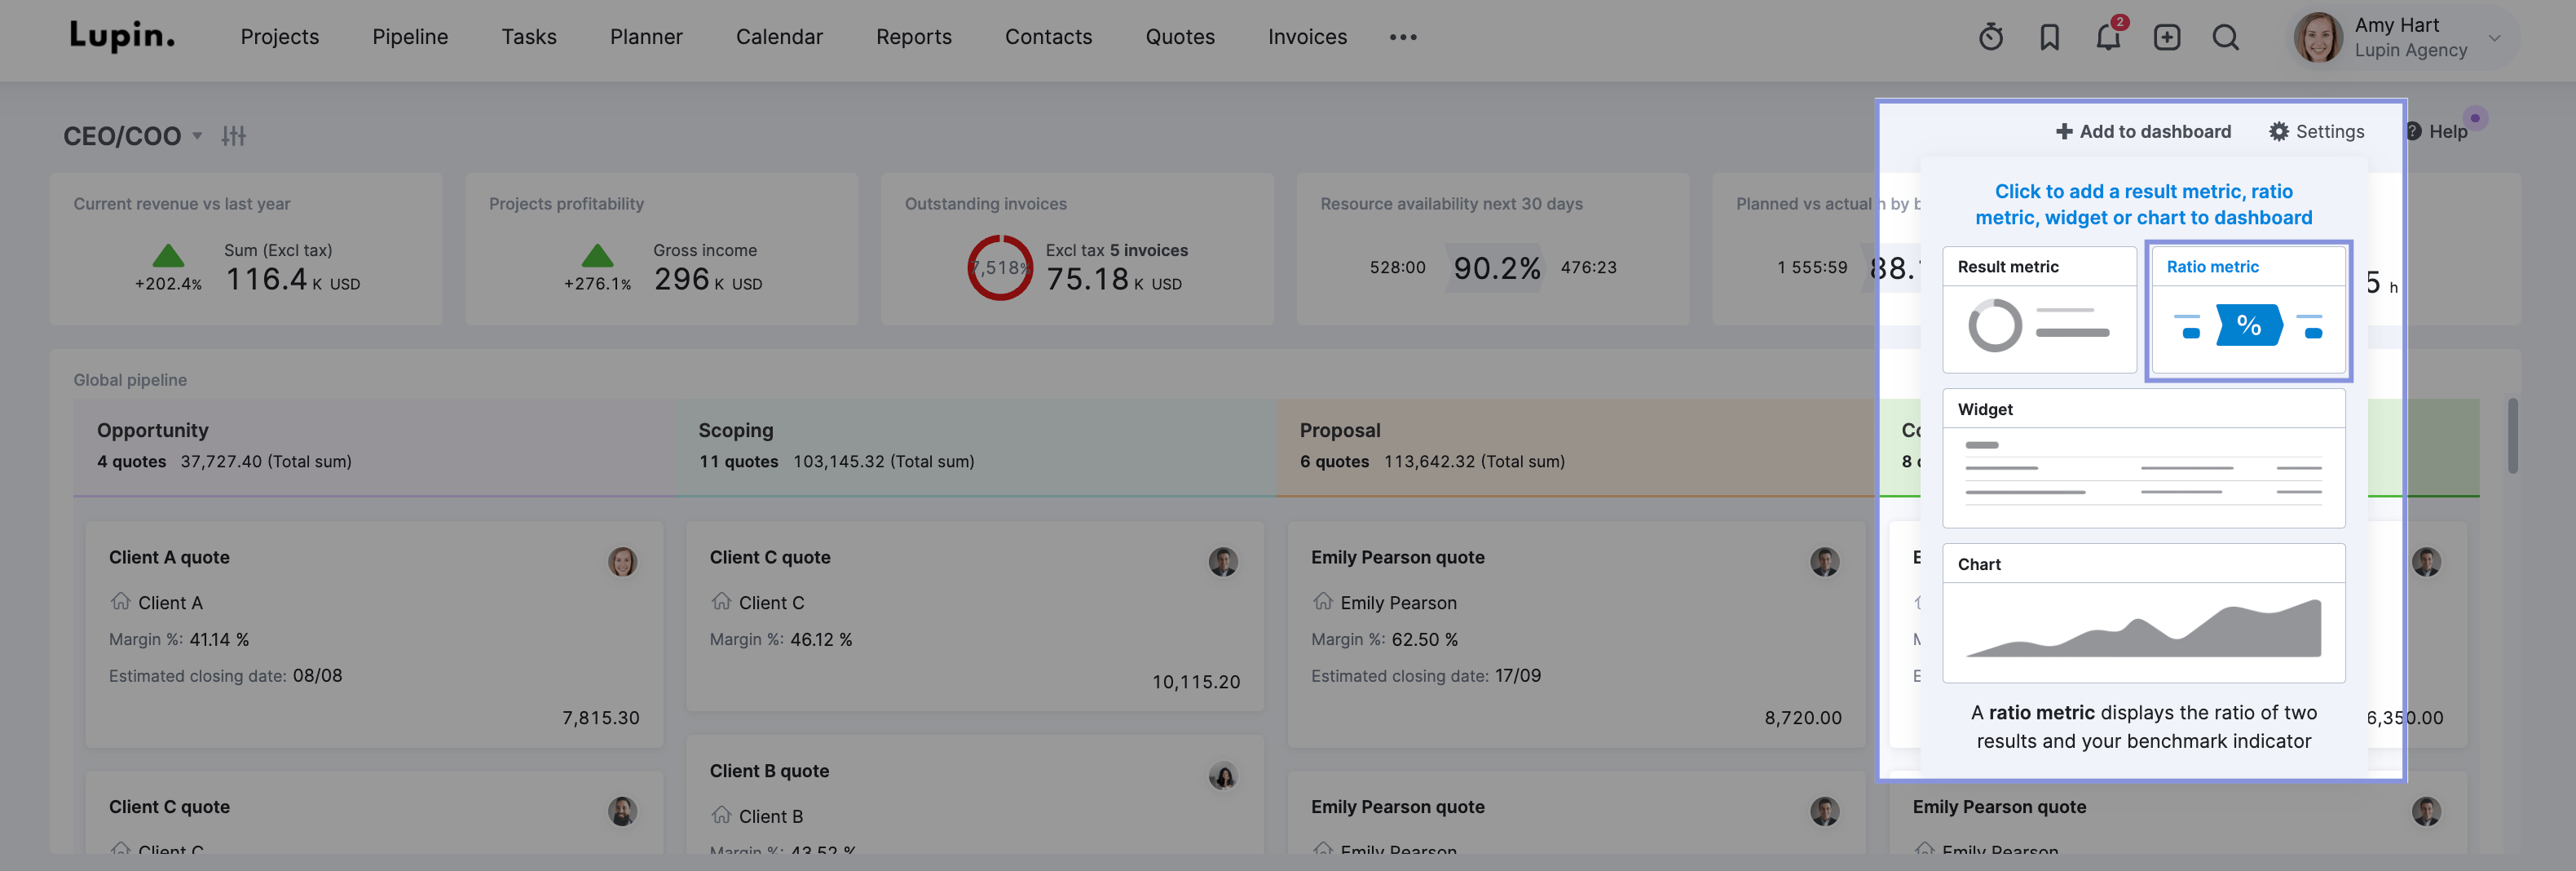
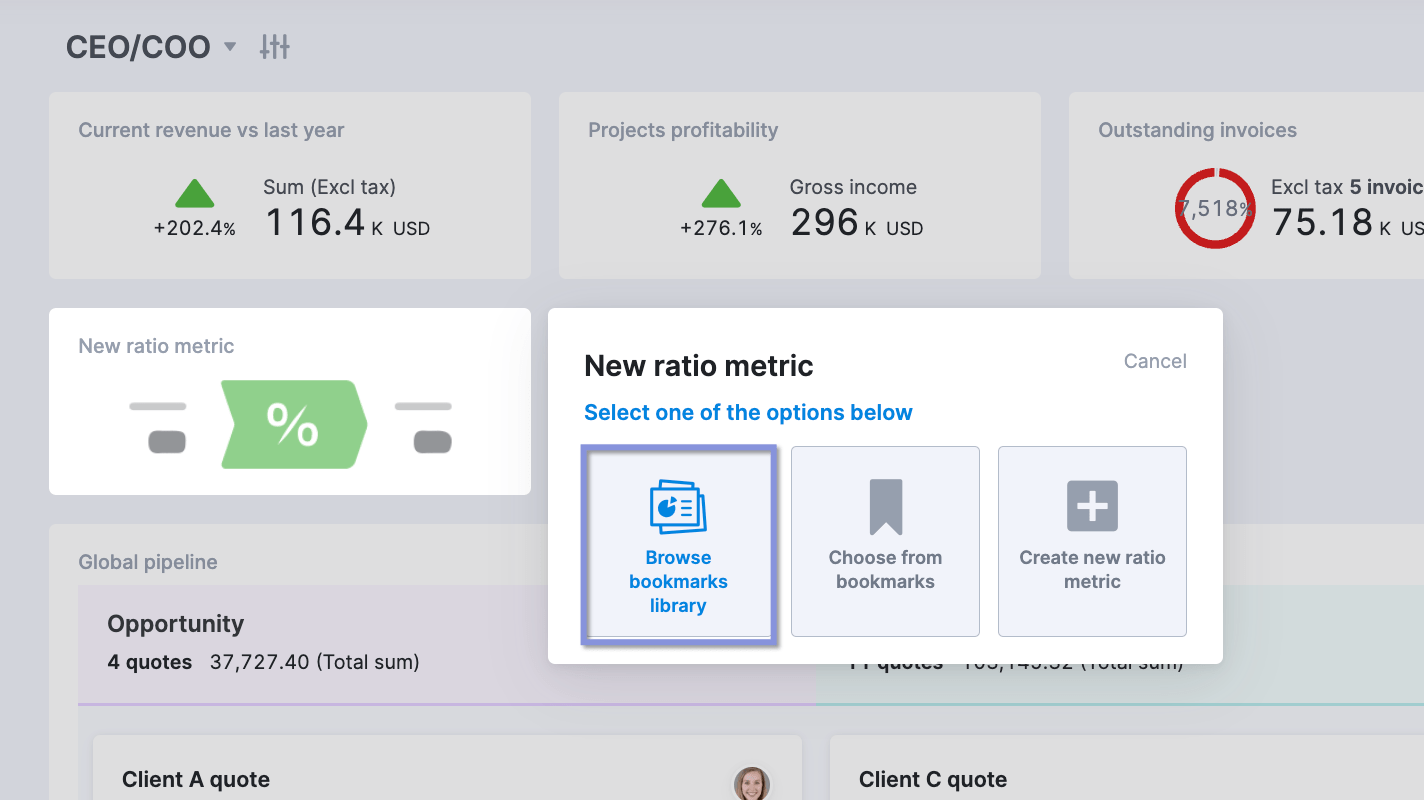
Then, select “Browse bookmarks library.”
Followed by “Sales” > “Sales conversion rate.”
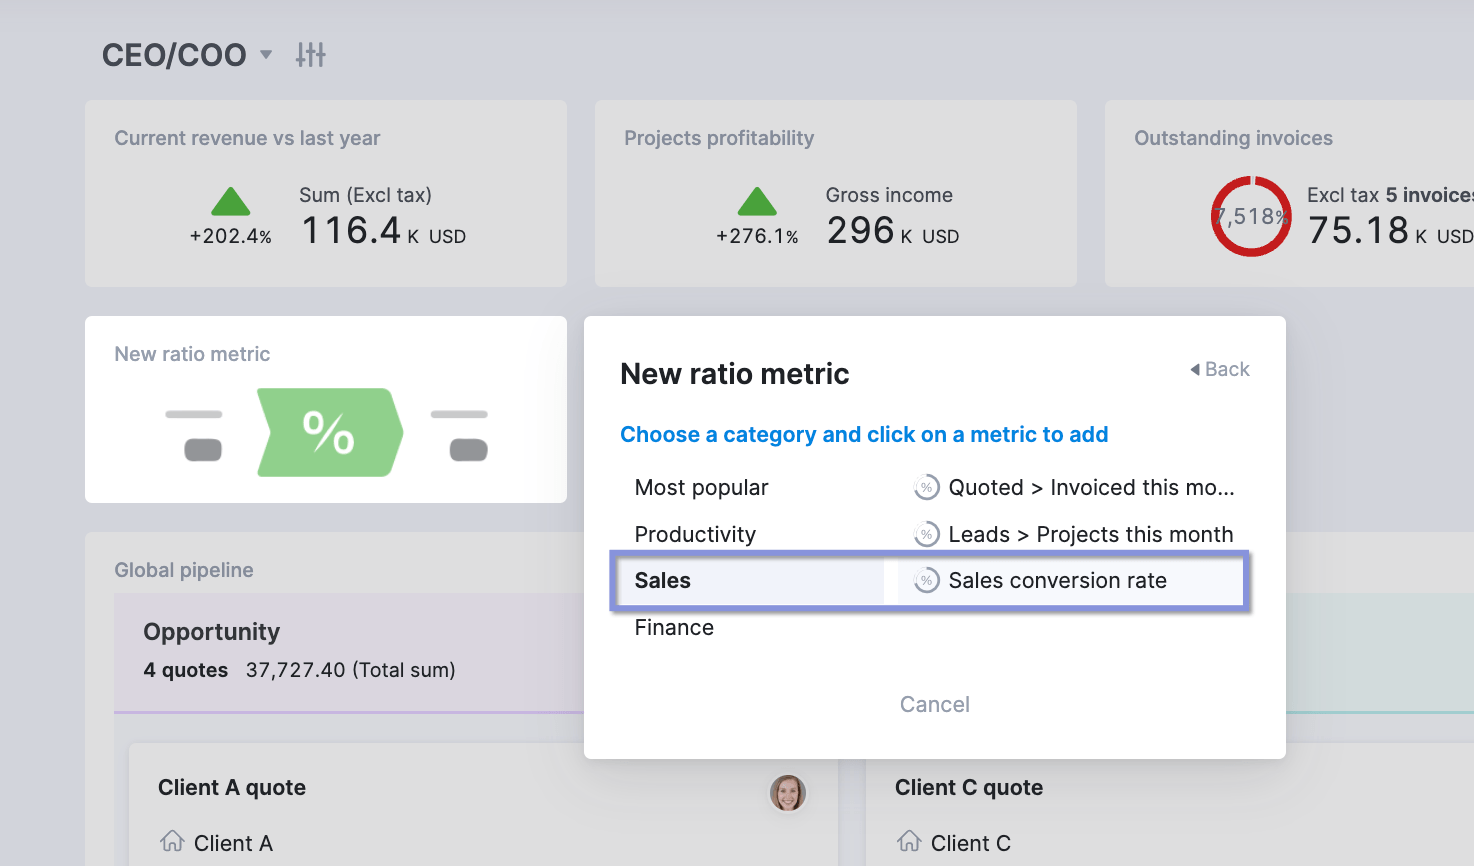
You’ll then see your sales conversion rate on your dashboard.
8. Profitability by client
Profitability by client measures how much each client contributes to your consultancy’s bottom line. It’s one of the most important project management KPIs. It measures all the revenue generated by individual accounts and the costs associated with their projects.
Example
Let’s compare the profitability of two clients.
Client A has brought in $130,000 in total revenue from various projects this year. The costs, including labor, materials, and overhead, amounted to $95,000. This leaves you with a total profit of $35,000. And a profit margin of 26.9%.
Client B seems impressive at first glance, with a higher total revenue of $140,000. However, with $117,000 in total costs, you only end up with a total profit of $23,000. And a 16.4% profit margin.
Despite generating less revenue, Client A was actually a more valuable client for your firm.
Why it matters
Client profitability helps you identify your most valuable client relationships, guiding decisions about where to focus your resources and business development efforts.
This insight can reveal surprising truths—like a smaller client being more profitable than your biggest account. This might prompt you to reassess your client engagement strategies. And adjust your service offerings or pricing.
How to track it
Add up all revenue from each client. Then, calculate the total costs (pass-through, labor, and overhead) associated with working with them. Subtract that number from your total revenue to get your profit.
To calculate the client’s profit margin percentage, apply this formula:
Client Profit Margin (%)=(Revenue per Client/Profit per Client )×100
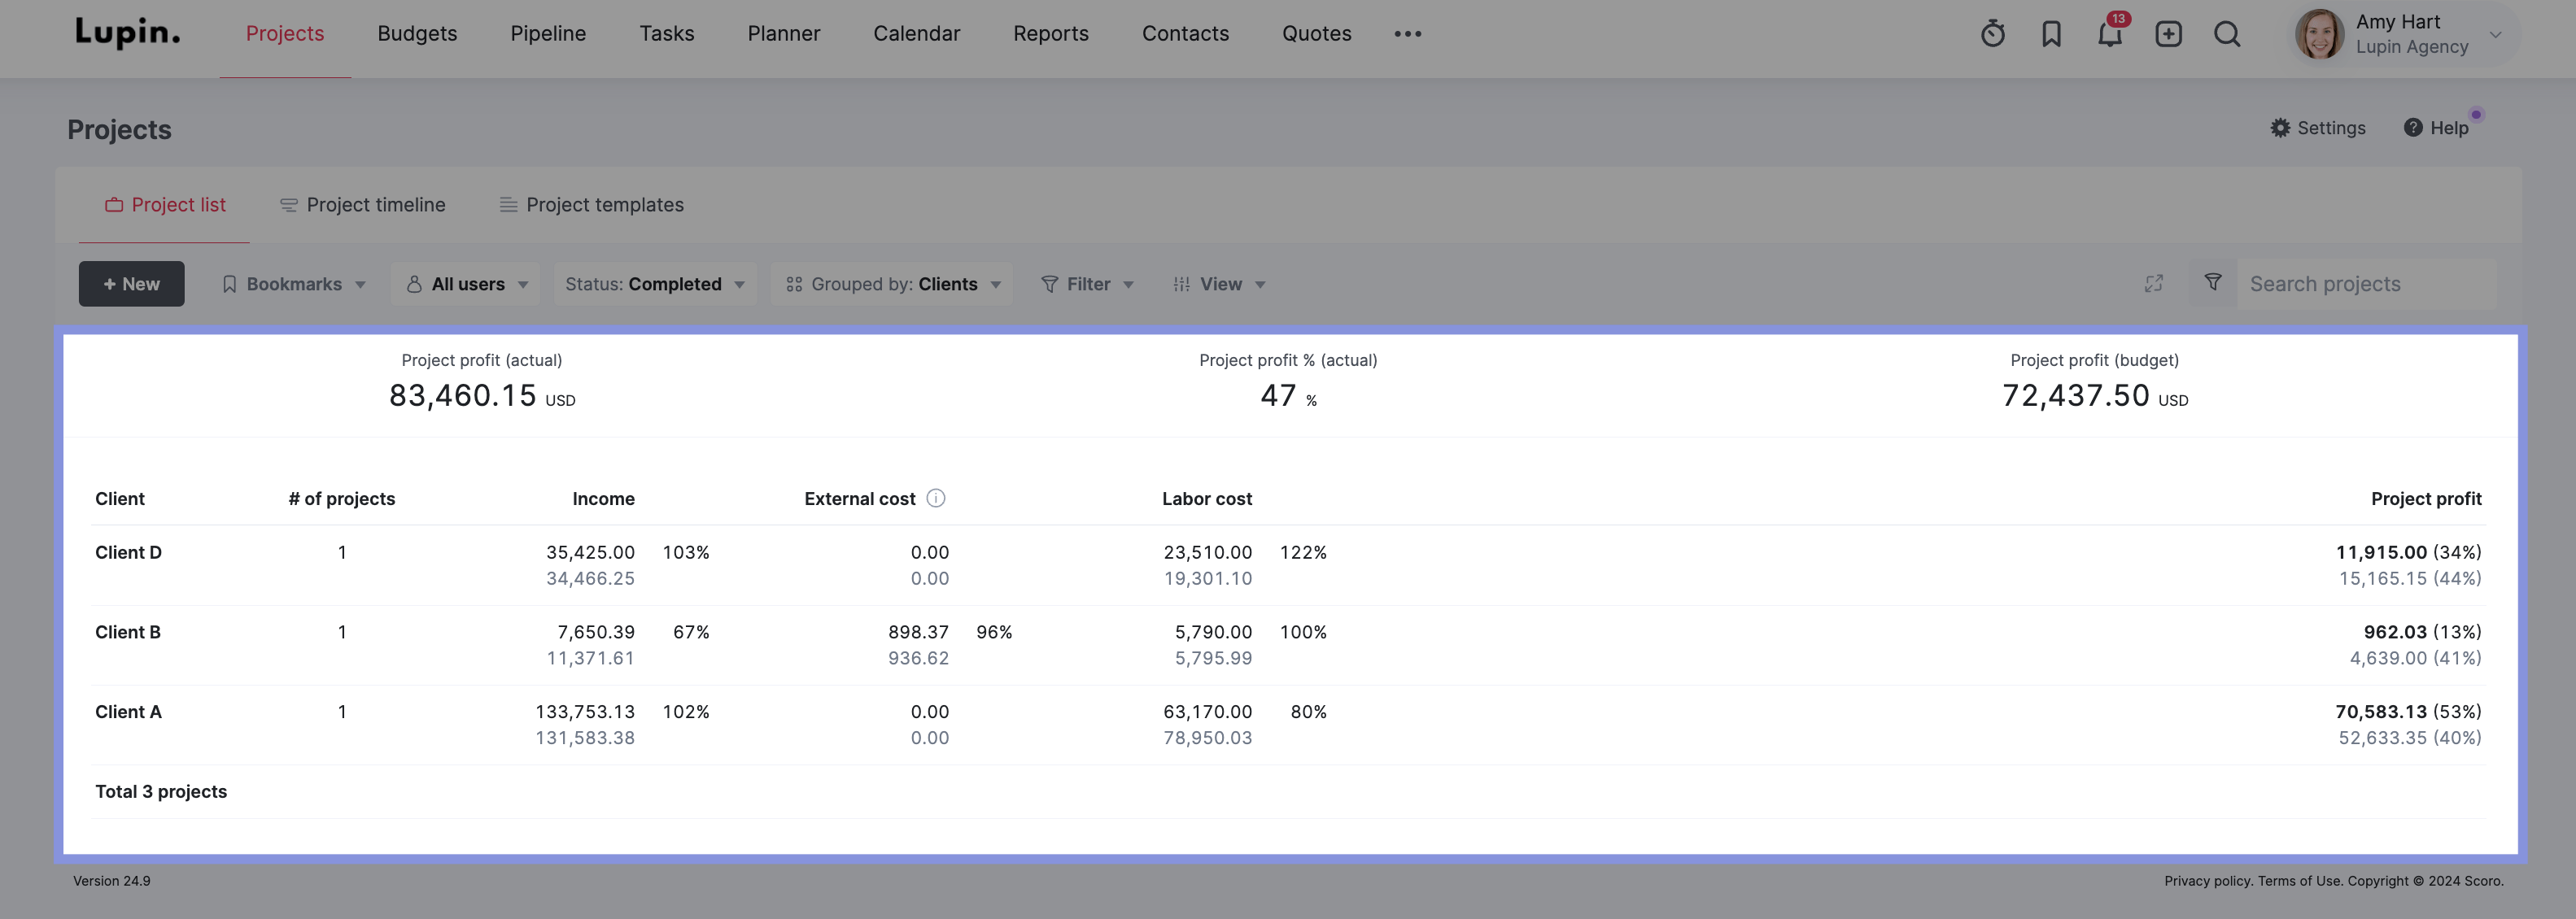
Scoro’s “Profitability by client” report shows you an overview of your clients and their respective income, costs, profit, and profit margin:
9. Profitability by project
Project profitability measures how much each individual project contributes to your firm’s financial success. It considers the specific revenue and costs associated with each project.
Example
You can often find patterns when looking at the types of projects your firm has completed and their profitability.
Say you discover that your marketing projects consistently go over budget, eating into your profits. But your IT projects tend to be faster—and more profitable.
These insights would dramatically shift your focus and strategy for future projects. Like boosting pricing for marketing projects. And concentrating on generating more IT leads and deals.
Why it matters
Understanding project profitability helps you identify which types of engagements are most lucrative for your firm. So you can decide:
- Which type of projects to take on
- How much to charge
- How to allocate and prioritize resources
How to track it
For each project, calculate the total revenue and all associated costs. Subtract the costs from the revenue to get your profit.
To determine the profit margin percentage, use this formula:
Project Profit Margin (%) = (Profit / Revenue) × 100
In Scoro, the “Profitability per project” report shows you each project’s income, costs, profit, and profit margin, allowing you to quickly identify your most profitable engagements.
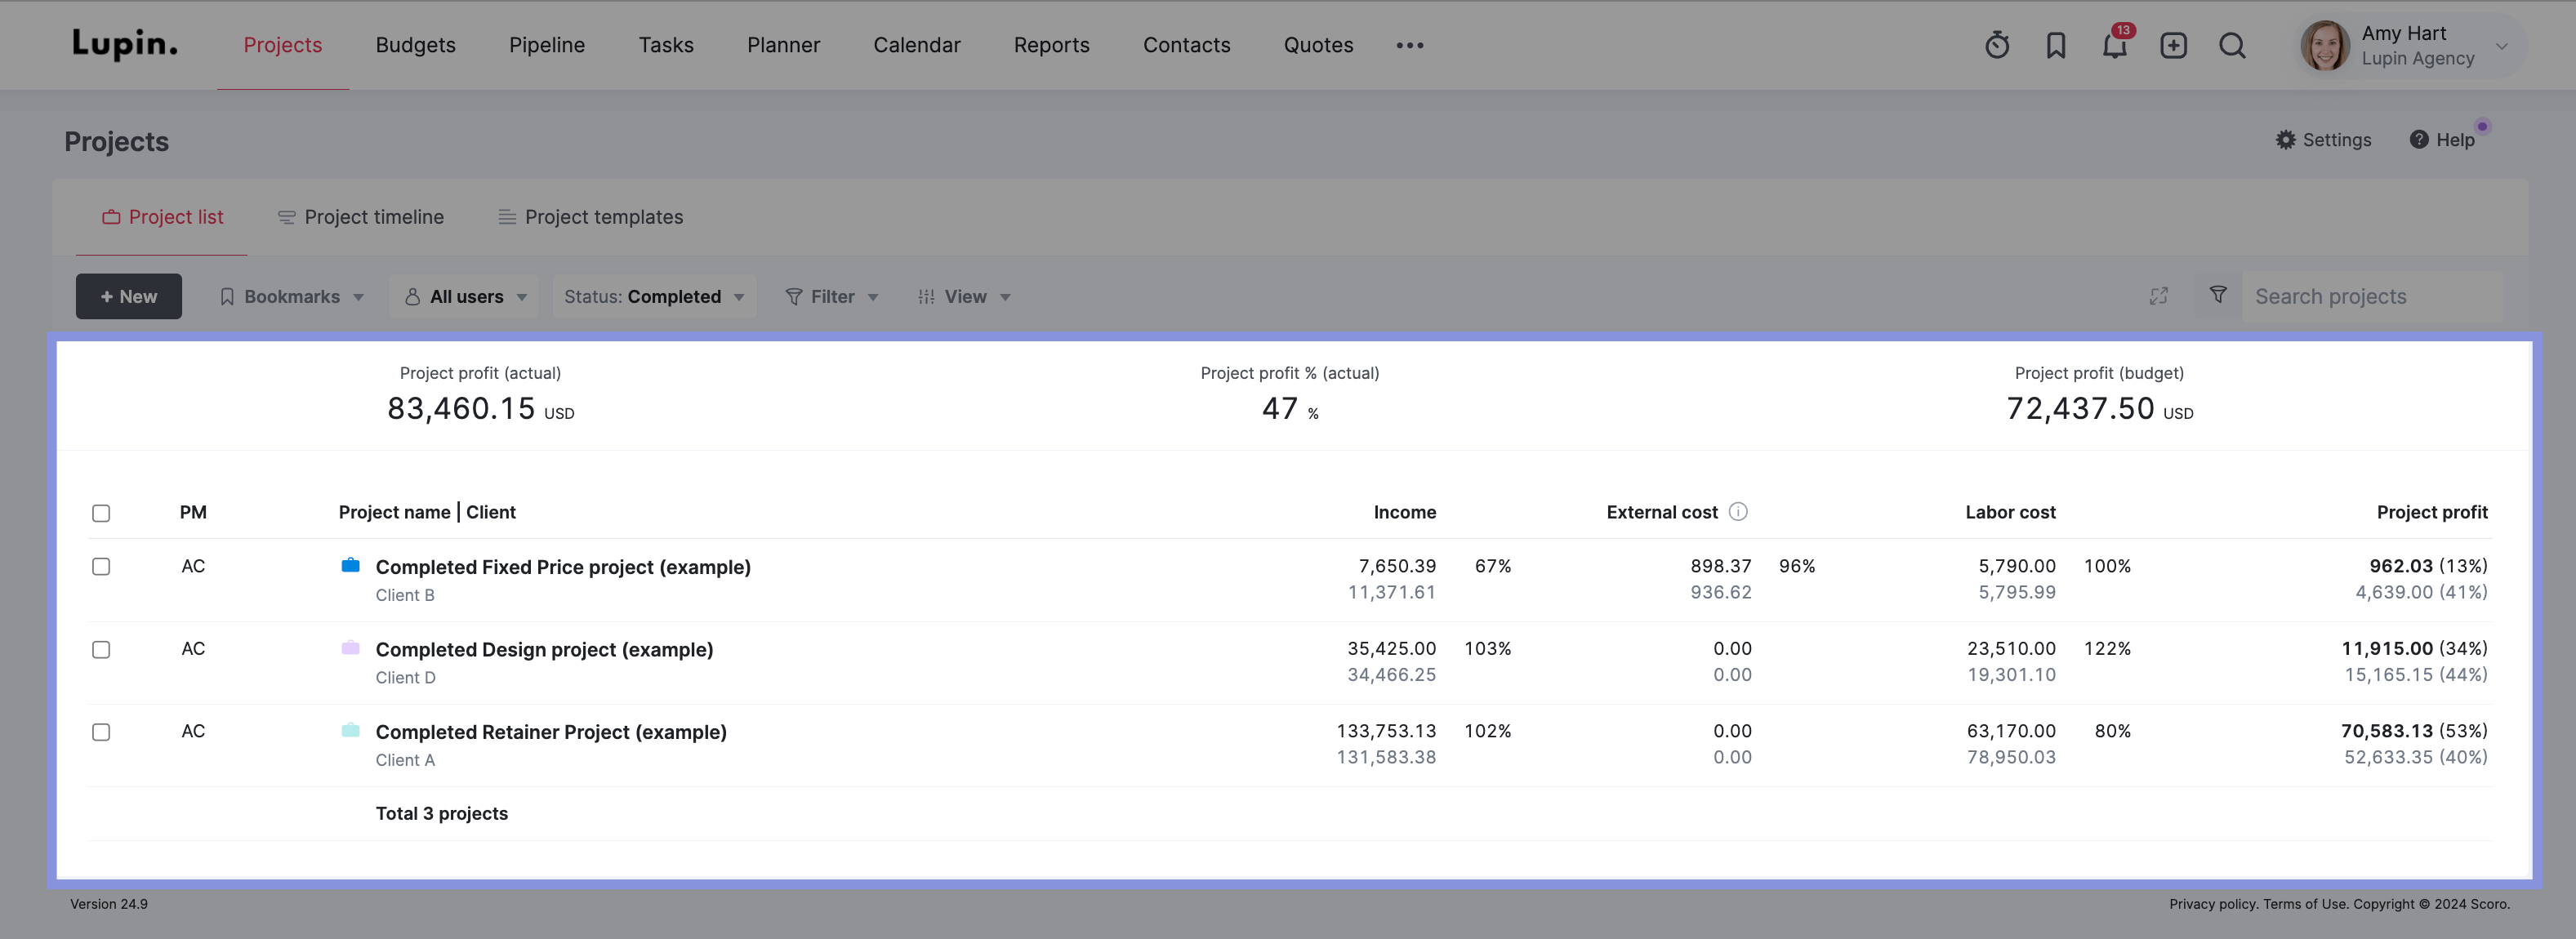
You can also check profitability (and more) anytime in the “Project” view in Scoro:
10. Average Billable Rate (ABR) per project
Average Billable Rate (ABR) per project is the average amount of revenue your consulting firm brought in for each hour spent on a project. You calculate it by dividing the total project revenue by the number of hours worked.
Example
ABR reveals the true profitability of your projects—beyond revenue.
Let’s say your highest-revenue project this quarter was a cybersecurity initiative that brought in $100,000. Sounds great, right?
But when you do some digging, you realize your consultants spent 1,000 hours on it. That means your ABR was only $100 per hour.
In comparison, a smaller process optimization project generated $50,000 but only took 400 hours of consultant time. So, you had an ABR of $125 per hour.
Suddenly, that “big” project doesn’t look quite as valuable.
Why it matters
ABR provides a clear picture of your firm’s profitability at the project level. It factors in both revenue and time invested. This helps you identify which types of engagements are most lucrative—and where you might be losing money due to time-intensive work.
Essentially, measuring your ABR helps you to:
- Focus on more on true high-value projects and clients
- Optimize your service offerings
- Avoid scope creep on time-intensive engagements
- Price future projects more accurately
How to track it
Take the total billable revenue for the project and divide it by how many hours your team spent on it.
Average Billable Rate (ABR)= Hours Worked on Project/Total Billable Revenue
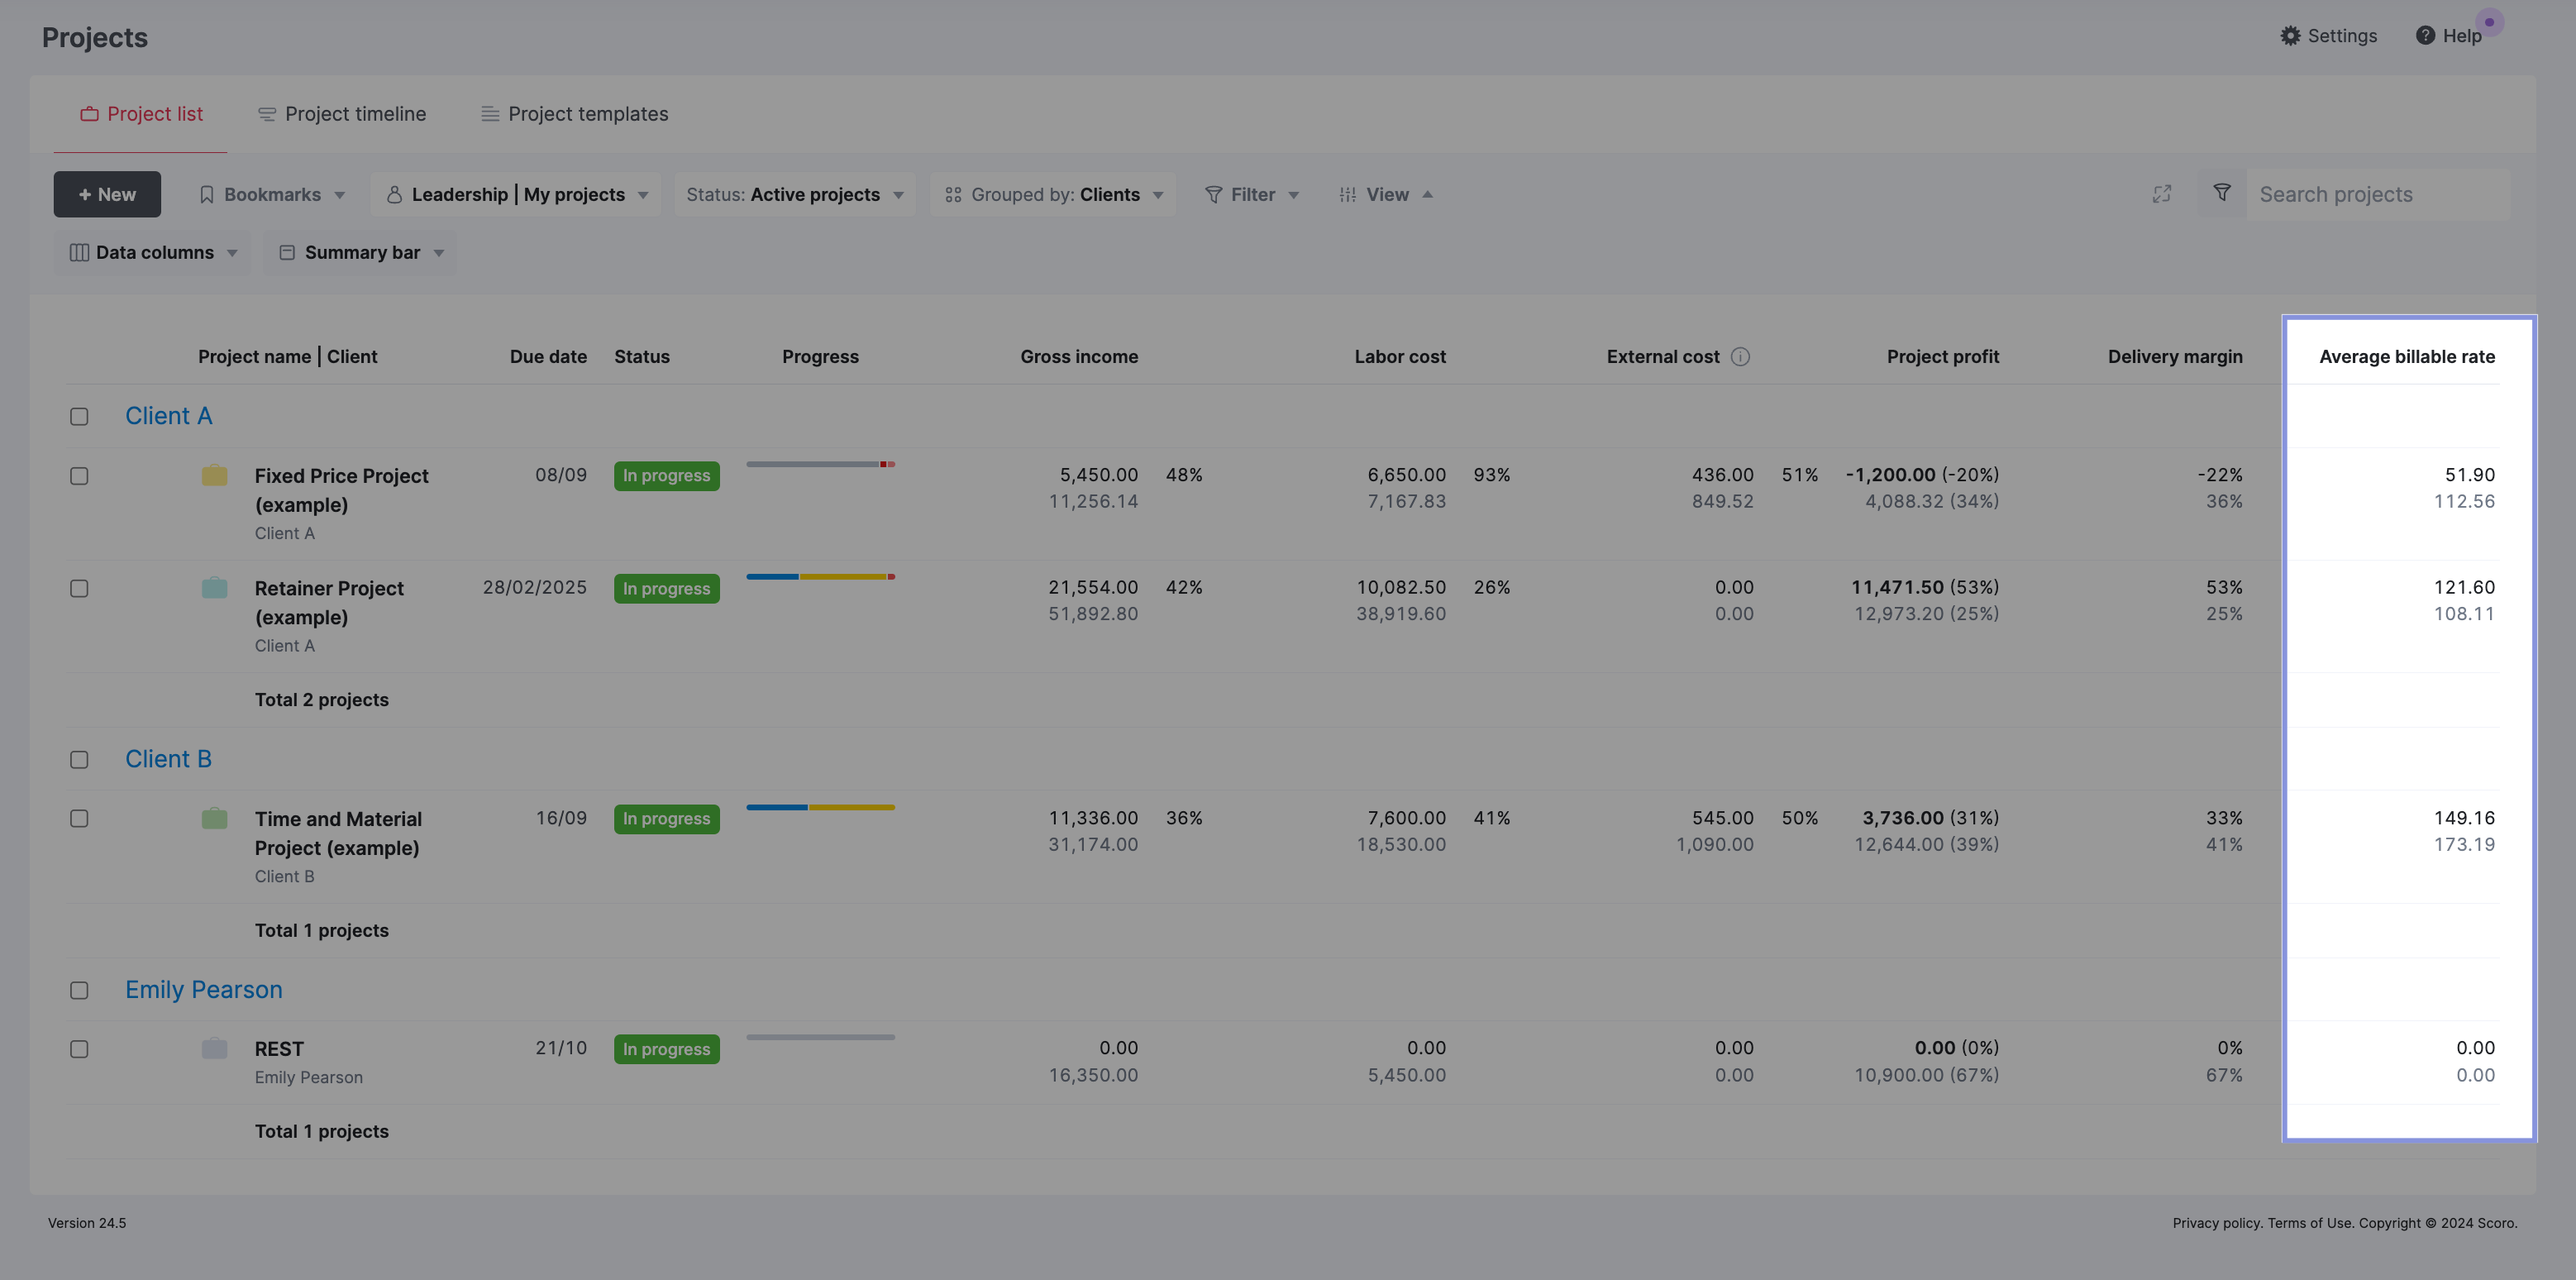
Or use Scoro to instantly view and analyze the ABR of your projects.
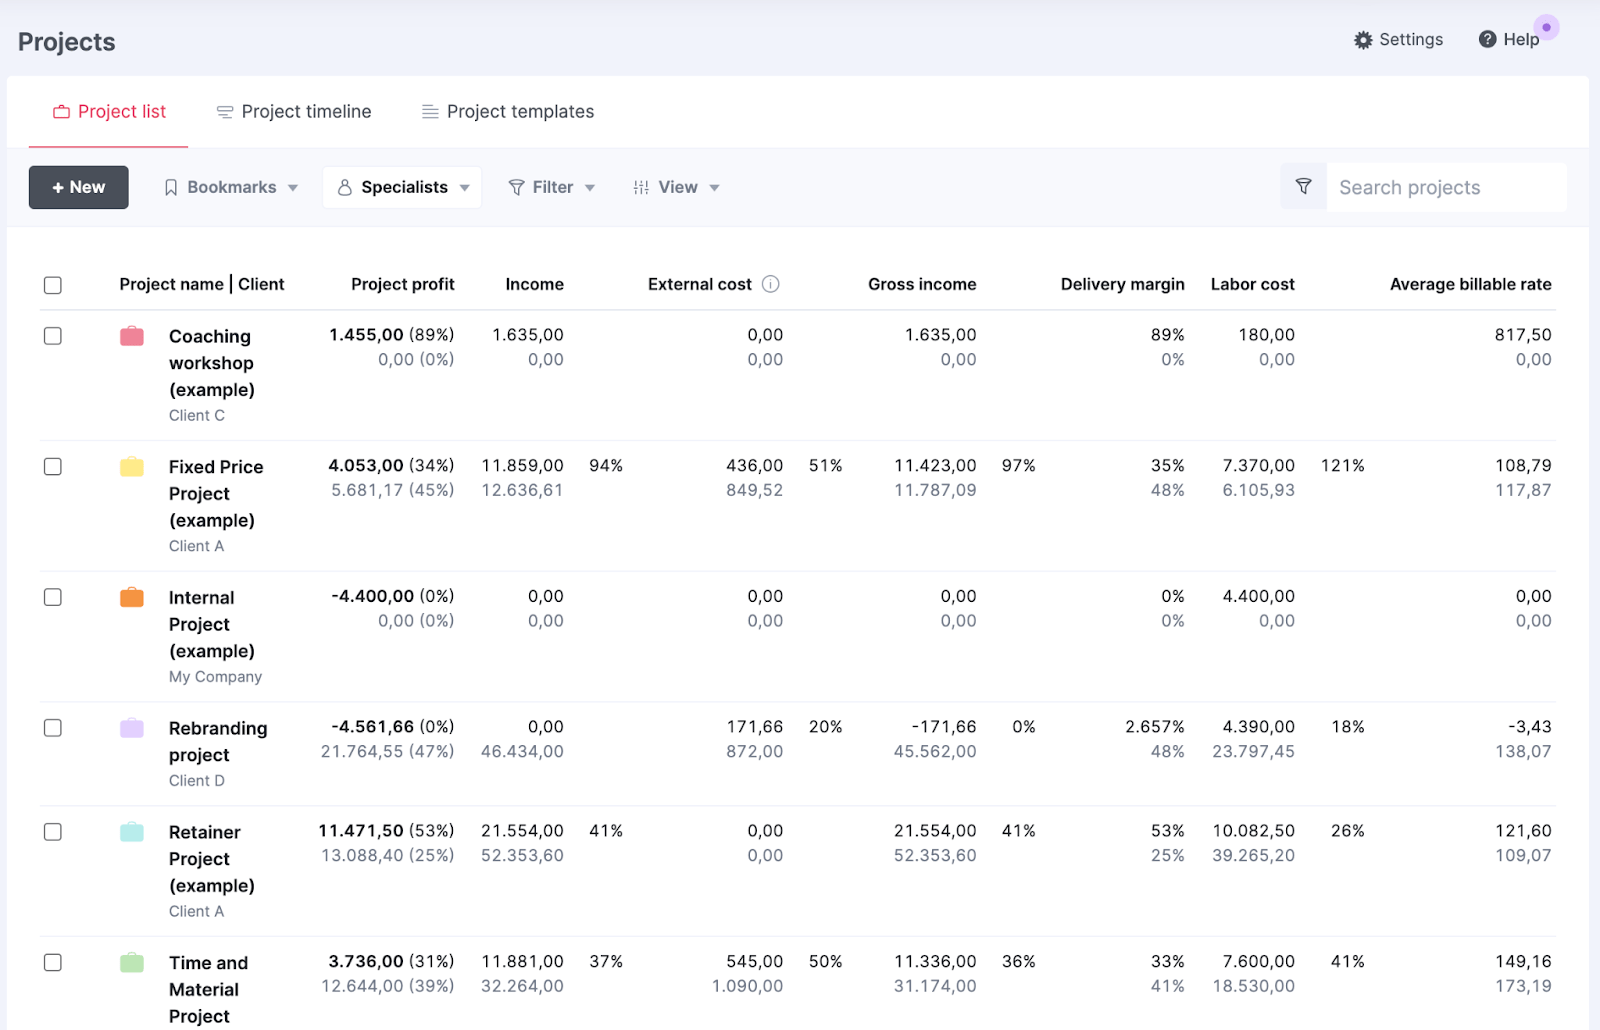
Just open the “Project” view. Then, click “View” → “Data Columns →” “Average billable rate.” And you’ll see the ABR for each project:
Top Tip
To calculate ABRs accurately, you’ll need a solid time-tracking system in place. Need some pointers? Check out our guide to time tracking best practices.
11. Project cost overrun
Ever had that sinking feeling of realizing a project is costing way more than you planned? That’s what we’re talking about with project cost overruns. It measures how often and by how much your projects go over budget.
Example
Let’s say your consulting firm did a growth marketing project for a tech startup. You quoted $50,000, but it ended up costing $55,000. That’s a $5,000 overrun. Or 10% over budget. Not terrible, but not great either.
Why it matters
When project costs overrun, it directly impacts your bottom line. It can also lead to uncomfortable conversations with clients about unexpected costs.
Looking at the cost overrun of your projects gives you a clear picture of where you might need to improve your cost estimations.
How to track it
Subtract the budgeted cost from the actual cost. Then, divide the difference by the budgeted cost and multiply by 100 to get the percentage overrun.
Project Cost Overrun (%)=((Actual Cost – Budgeted Cost) / Budgeted Cost)×100
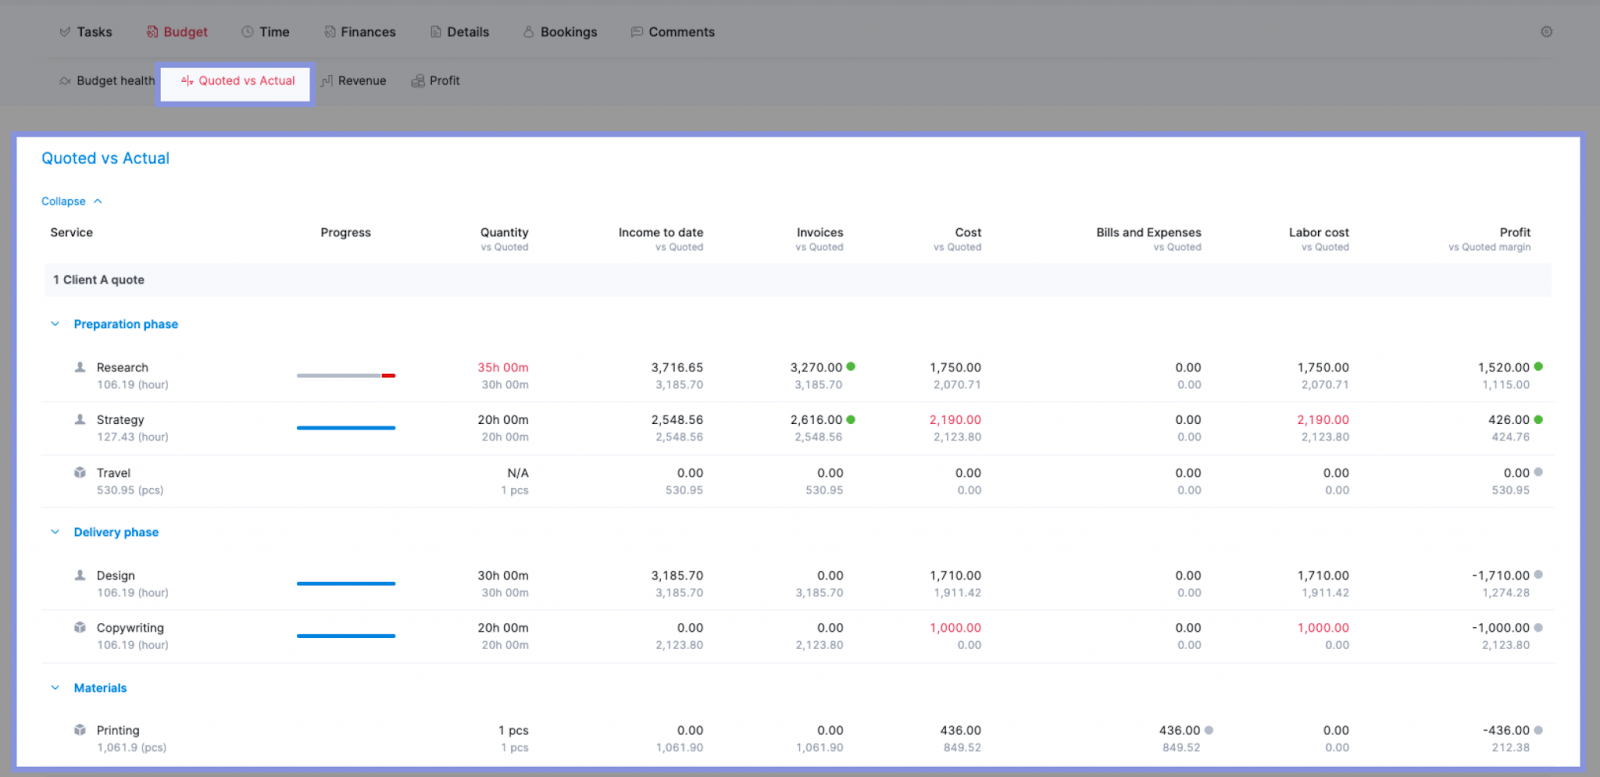
If you want to skip the math, though, just head to Scoro’s “Quoted vs. Actual” table.
In each column, you’ll see your project’s current figures (black text) and planned estimates below it (gray text). This makes it easy to compare and spot any discrepancies.
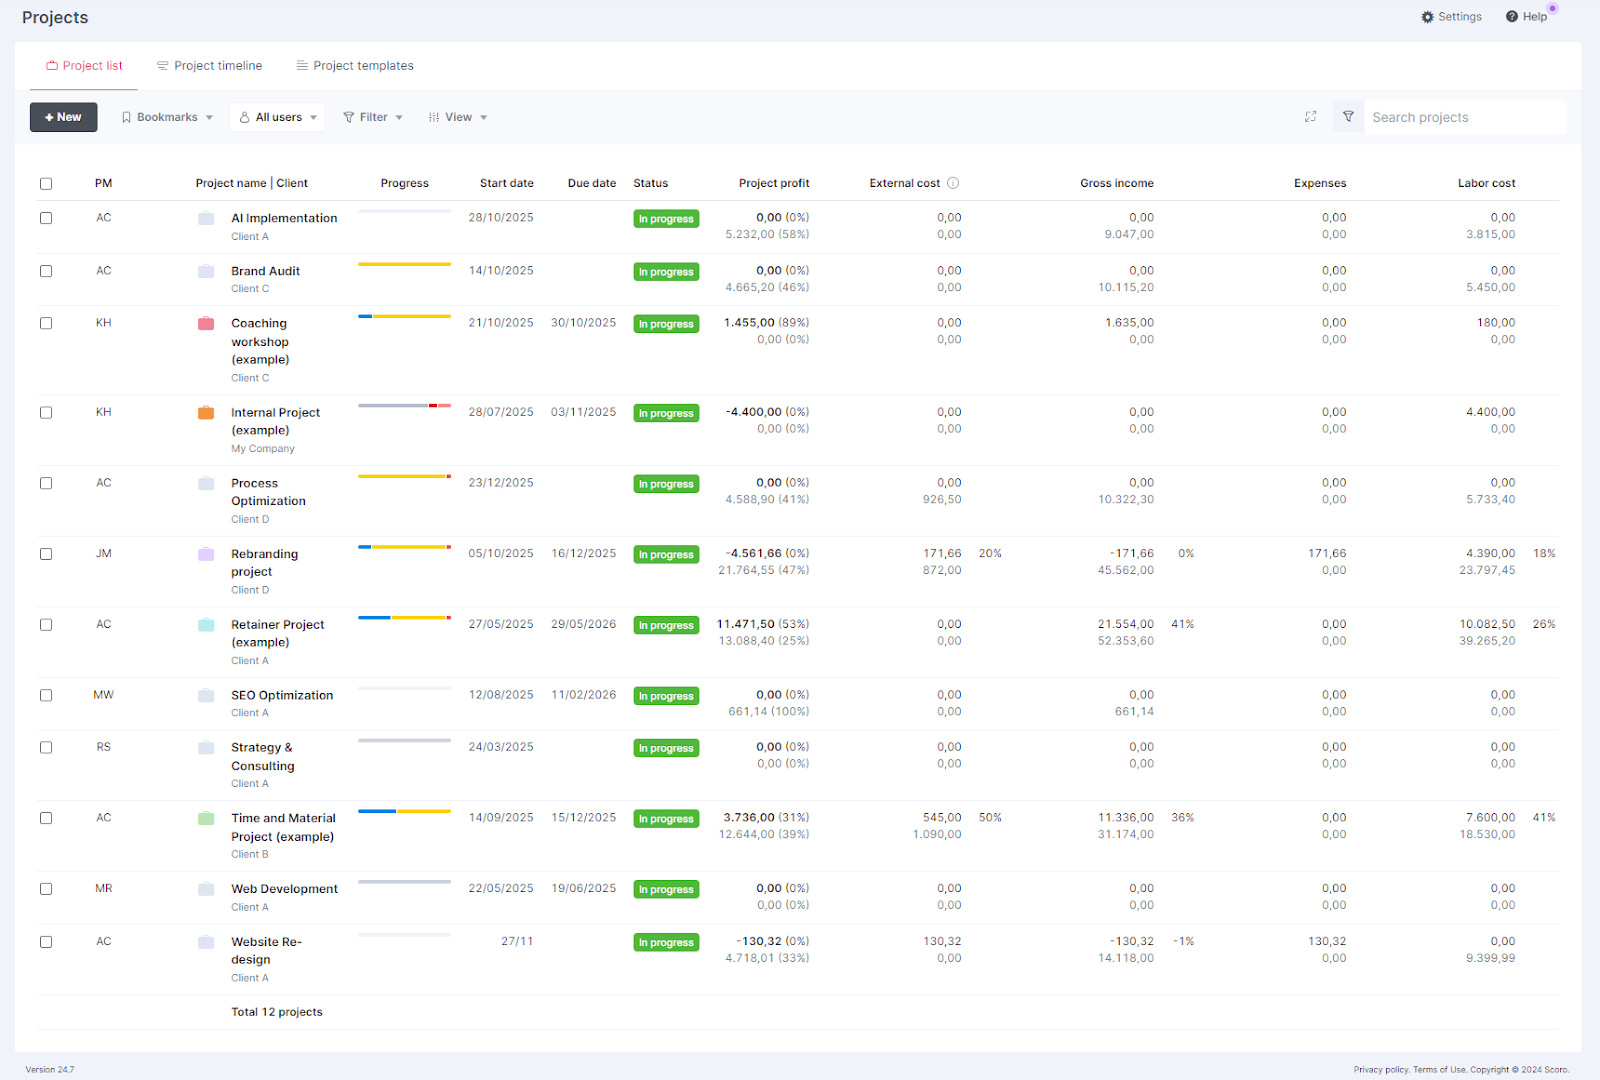
For an overview of all your projects and their costs, navigate to the “Projects” module. Hit “View” → “Data columns.”
Then, check the columns you need. In this case, we added “Project profit,” “External cost,” “Gross income,” “Expenses,” and “Labor Cost.”
Further reading: How to Create and Manage a Project Budget
Track and improve your consulting KPIs
By monitoring these KPIs for consulting services, you gain key insights into your firm’s health, productivity, and profitability.
And with Scoro’s all-in-one management platform, you can track and visualize these vital KPIs in real-time. And when these metrics are easily trackable, you can take concrete steps to improve them—well before your projects are finished.
Take Cosmonauts & Kings, a communications consultancy. After they switched to Scoro, they were able to increase their billable utilization and reduce overservicing.
Learn more about our consultancy management software and try Scoro for free today.