
Operations managers in agencies have a lot on their plates—making sure projects run well, teams stay on task, and money is being spent wisely.
But without the right numbers, it’s hard to tell how things are really going.
Below are the most important things to track to keep your agency running smoothly, along with tips from experienced leaders on what really makes a difference.
1. Billable utilization rate
Billable utilization shows how much of your team’s time is spent on client work that brings in revenue.
It’s different from overall resource utilization, which includes both client work and internal tasks like meetings or admin.
Let’s say your agency has 10 designers, each available for 160 hours a month.
Ideally, they should spend about 75% of their time on billable work.
But after reviewing the numbers, you find they’re only hitting 55%.
At the same time, their total workload is at 95%, meaning they’re busy—but too much of that time goes to internal work or poorly scoped projects.
This causes two big problems:
- You lose revenue because too much time goes to non-client work
- Your team risks burnout from working near full capacity without enough billable output
If you’d been tracking this in real time, you could have shifted some internal work to support staff, freeing up your team to focus more on client projects and improving profitability.
But what are “good” billable utilization benchmarks?
This purely depends on the role you’re looking at.
Parakeeto CEO Marcel Petitpas recommends aiming for:
| Role | Target | Notes |
|---|---|---|
| Pure producers (designers, developers, copywriters) | 75% | Most of their time is spent on client projects, so a high rate is expected. |
| Delivery, account, and project managers | 35%+ | They focus on overseeing work, not doing it, so the target is lower. |
| Support roles (admins, sales) | Above 0% | Billable time is a bonus—their main job is to support revenue activities. |
A good company-wide average is about 65%, which accounts for both client-facing and internal roles, as well as time off.
A resource management tool like Scoro can help track billable utilization in real time.
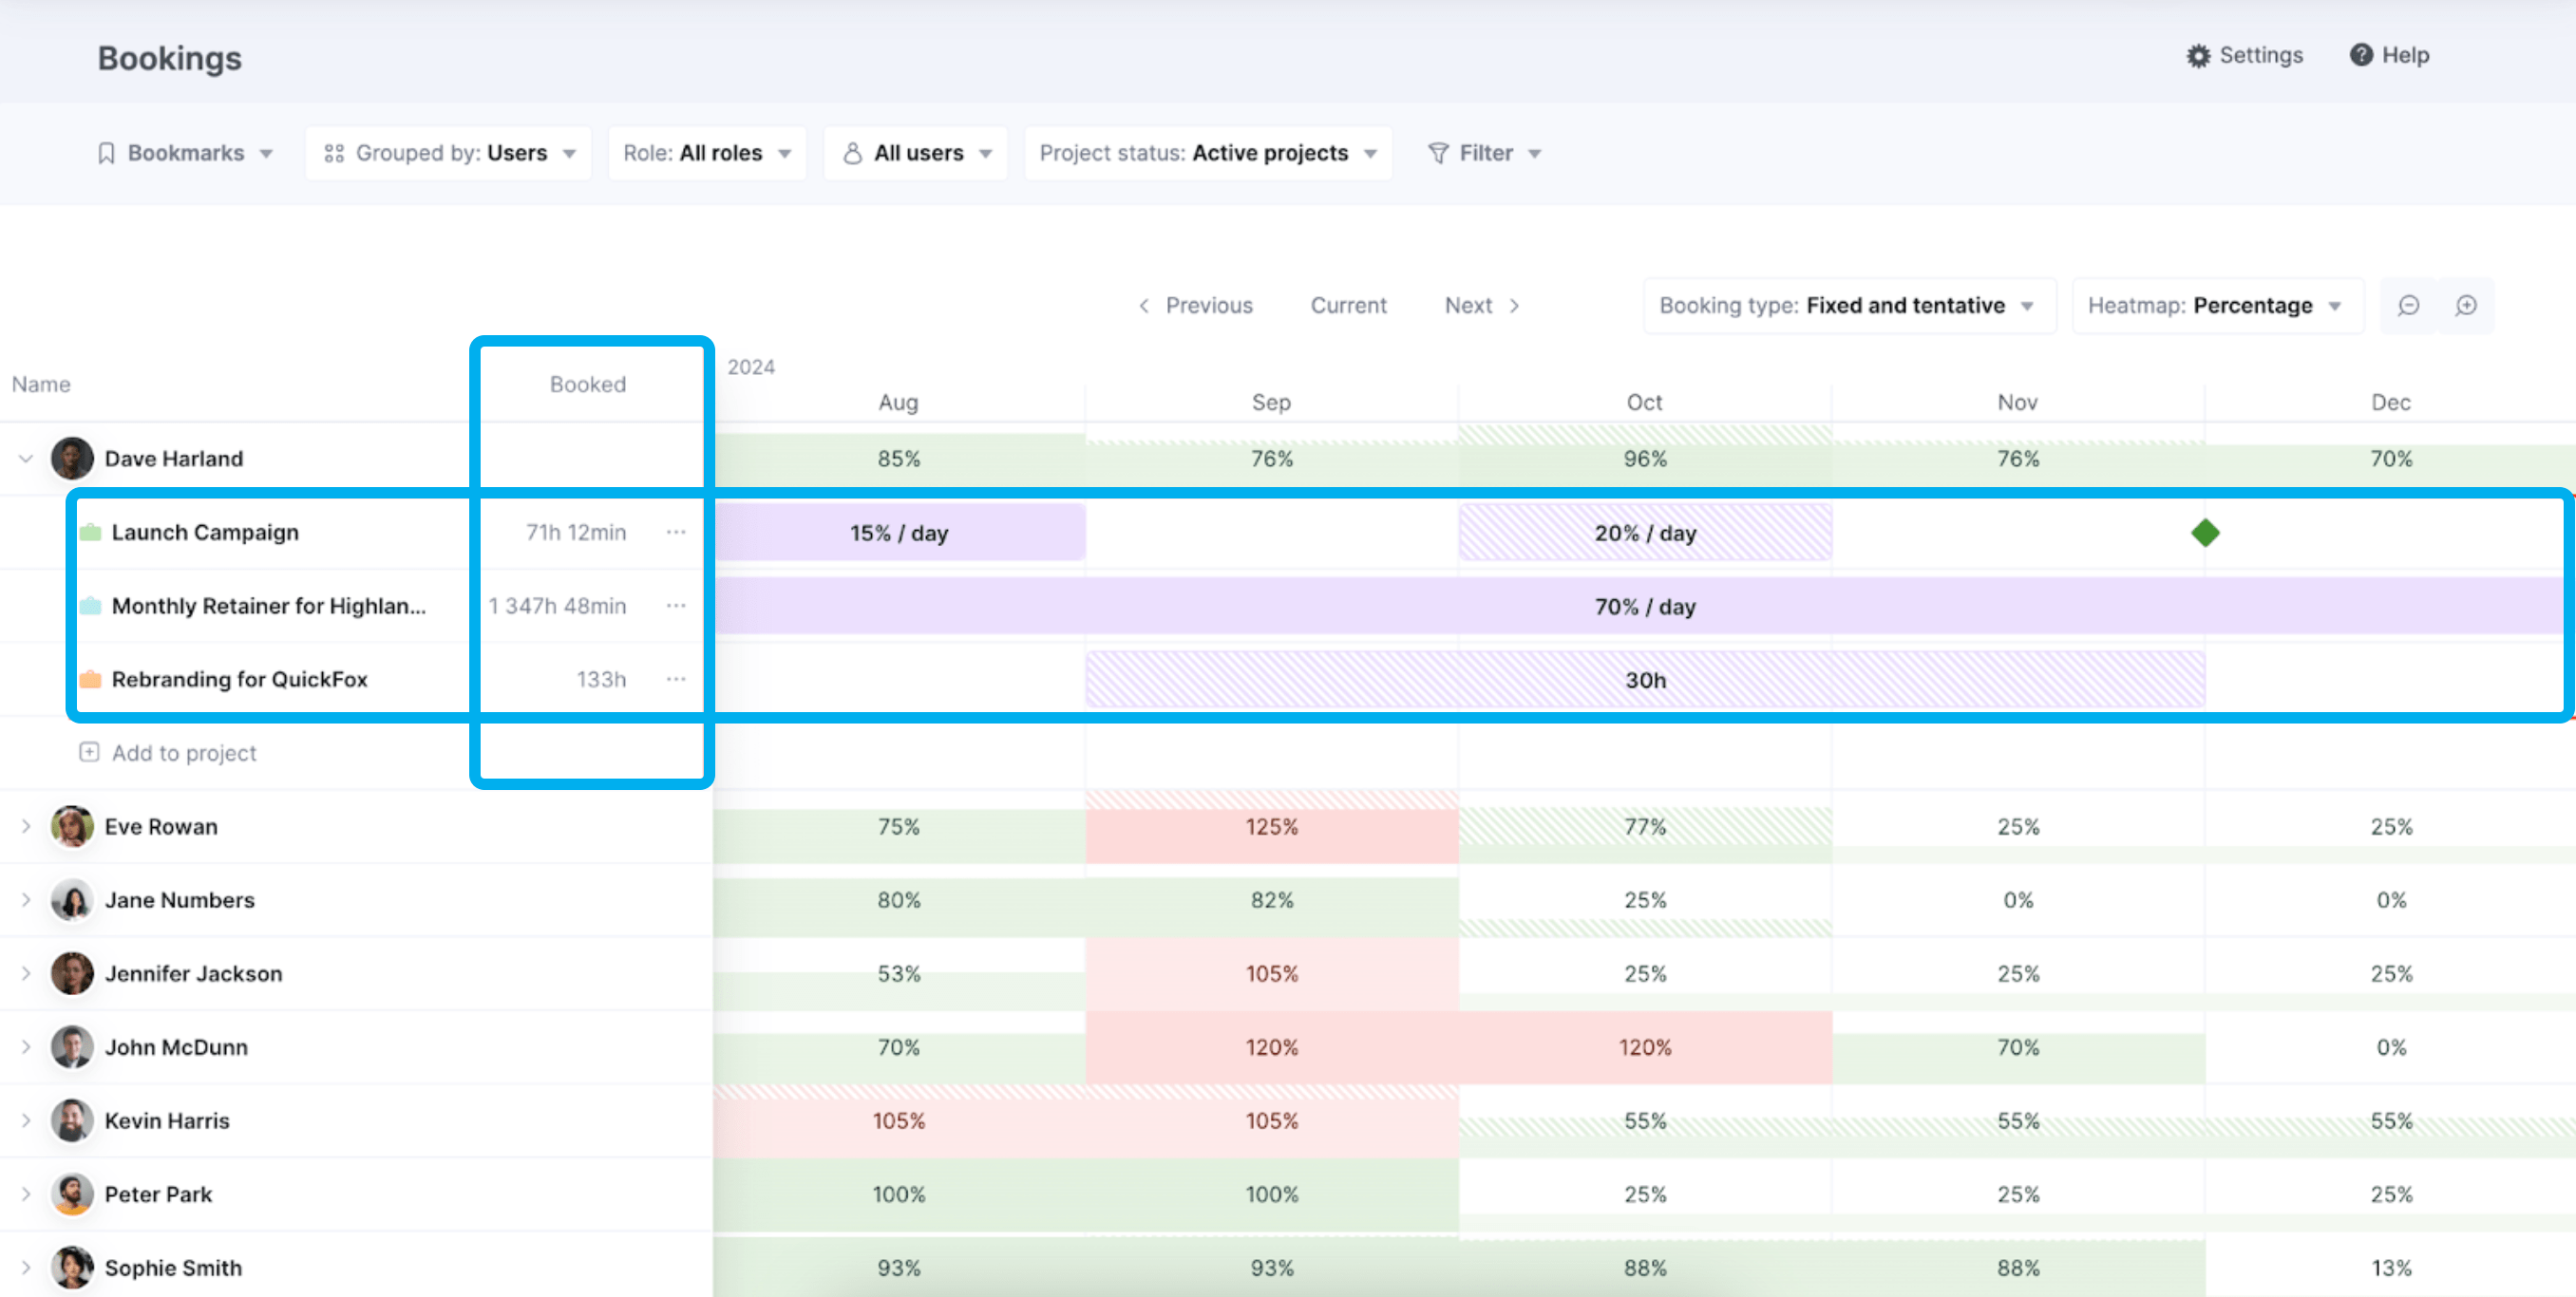
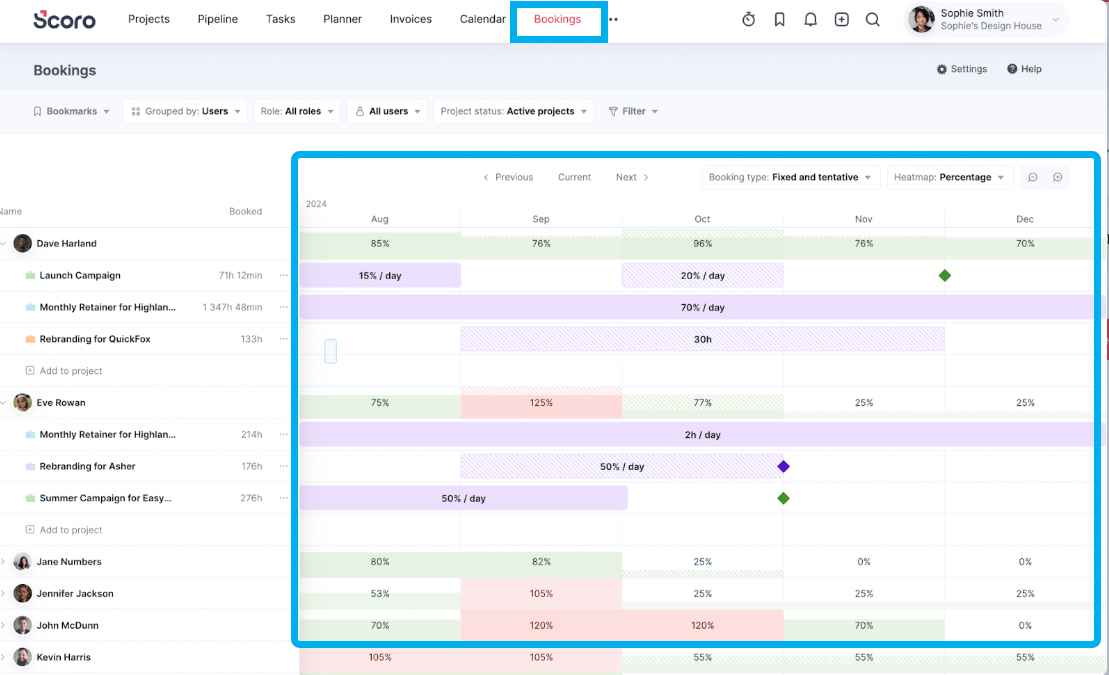
The project portfolio “Bookings” view lets you plan your team’s time across all projects, so you always know who’s available and when.
It includes a calendar-style heatmap that gives you a clear view of your team’s capacity.
The color-coded display makes it easy to spot availability or overbooking at a glance:
- Green = time is available
- Red = overbooked (too much work assigned)
- Striped = tentative booking (not confirmed yet)
- Solid = fixed booking (confirmed work)
- Yellow/violet corners = time off or extra availability
You can switch between day, week, or month views, and group the heatmap by individual people or roles (like “Designer”).
Click on a person or role to see exactly what they’re booked on and when.
This view helps you make better resourcing decisions and avoid overloading your team.
DGA Group, a global consultancy, was facing low billable utilization due to poor time tracking and disconnected tools.
Some teams weren’t logging hours at all, making it hard to measure performance or workload accurately.
After switching to Scoro, time tracking became simple and accessible.
Managers could instantly see how time was being used across teams.
Within a year, billable utilization jumped by 20%, improving both profitability and how resources were allocated.
“With Scoro, there’s no excuse not to log time. It’s easy, accessible on any device, and allows us to track staff utilization and project progress in real time.”
— Luis Perez, Head of FP&A, DGA Group

2. Project profit (delivery) margins
Project profit margin (also known as delivery margin) shows the gap between what you expected to earn on a project and what you actually earned after all costs (internal and external) are accounted for.
A project might bring in a lot of revenue, but if costs aren’t controlled, you can still end up losing money.
If you’re not tracking this closely, you risk:
- Scope creep: Doing extra work without extra pay
- Underpriced projects: Where your costs outweigh the fee
- Poor resource planning: Leading to wasted hours and lower returns
Real-time margin tracking is your early warning system—it tells you when a project’s in trouble while there’s still time to fix it.
For example, let’s say you sign a $100,000 fixed-fee project and expect to make $30,000 after covering labor and other expenses.
But halfway through, things start to slip—extra revisions, more meetings, and team members pulled in at the last minute.
Costs quietly climb by $20,000.
If you’re not watching the numbers in real-time, you won’t realize the problem until the project is over.
And by then, it’s too late:
- You can’t charge for the extra work
- You’re left with just $10,000 in profit
- Your team is stretched thin and frustrated
With live visibility into costs vs. forecast, you could have caught the overages early. Adjusted the scope, reset client expectations, or reallocated resources to protect your margin.
Design de Plume, a creative agency in Canada, struggled to keep project budgets on track.
Relying on spreadsheets and disconnected tools made it hard to spot when costs were creeping up—leading to over-servicing that often went unnoticed until the project was over.
After switching to Scoro, the team gained real-time visibility into budgets vs. actuals.
This allowed them to:
- Track budget vs. actuals in real time and prevent over-servicing
- Adjust pricing and scope proactively, ensuring profitability on every project
- Increase overall project profitability by 20% within a year
Now, we can educate our clients about how changes impact the project. We’re having better conversations about scope, and we’re making sure our work remains profitable.
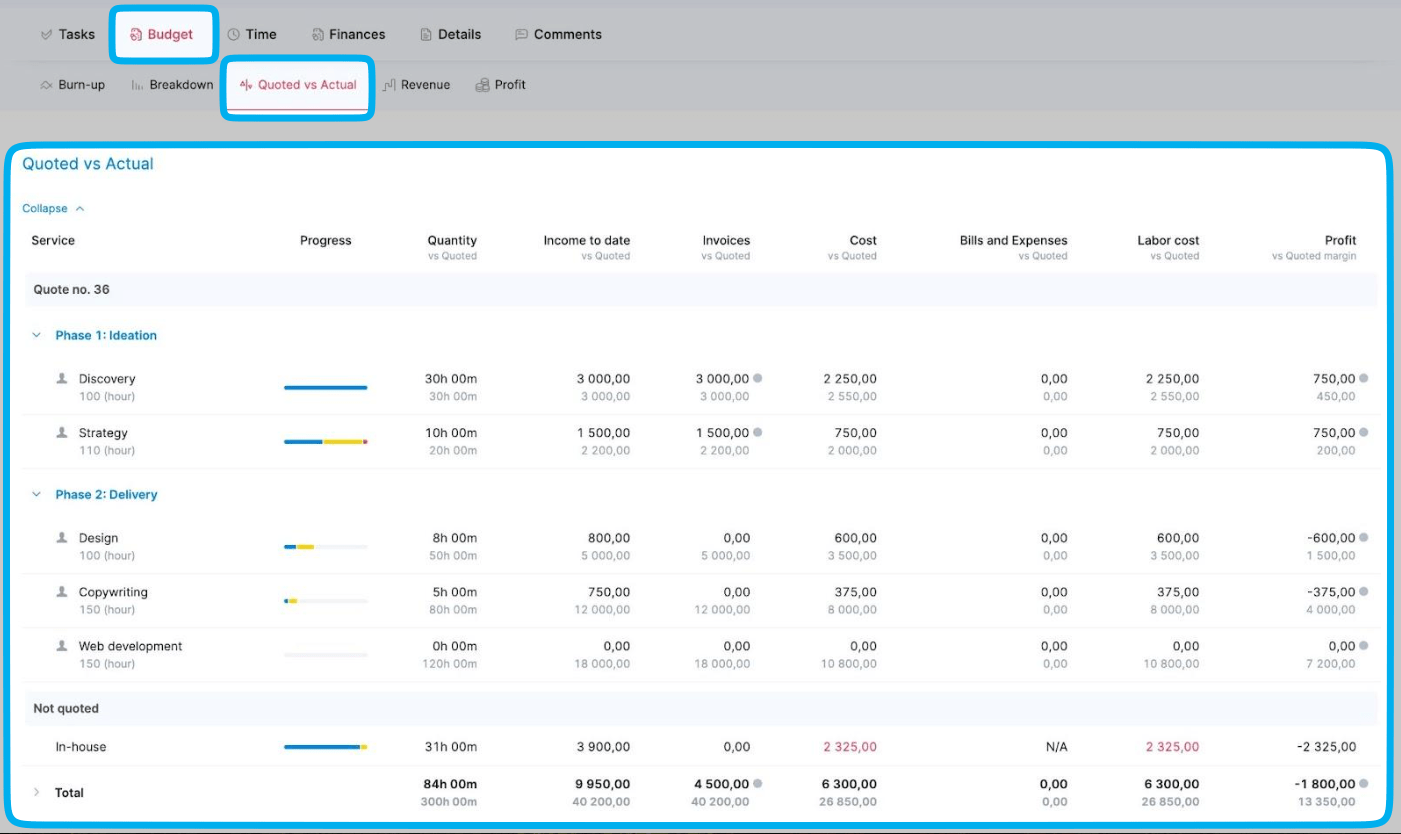
Scoro’s “Budget health” charts make it easy to keep project budgets on track.
The Burn chart shows how your actual and forecasted costs compare to your total budget, helping you spot overservicing early and protect your margins.
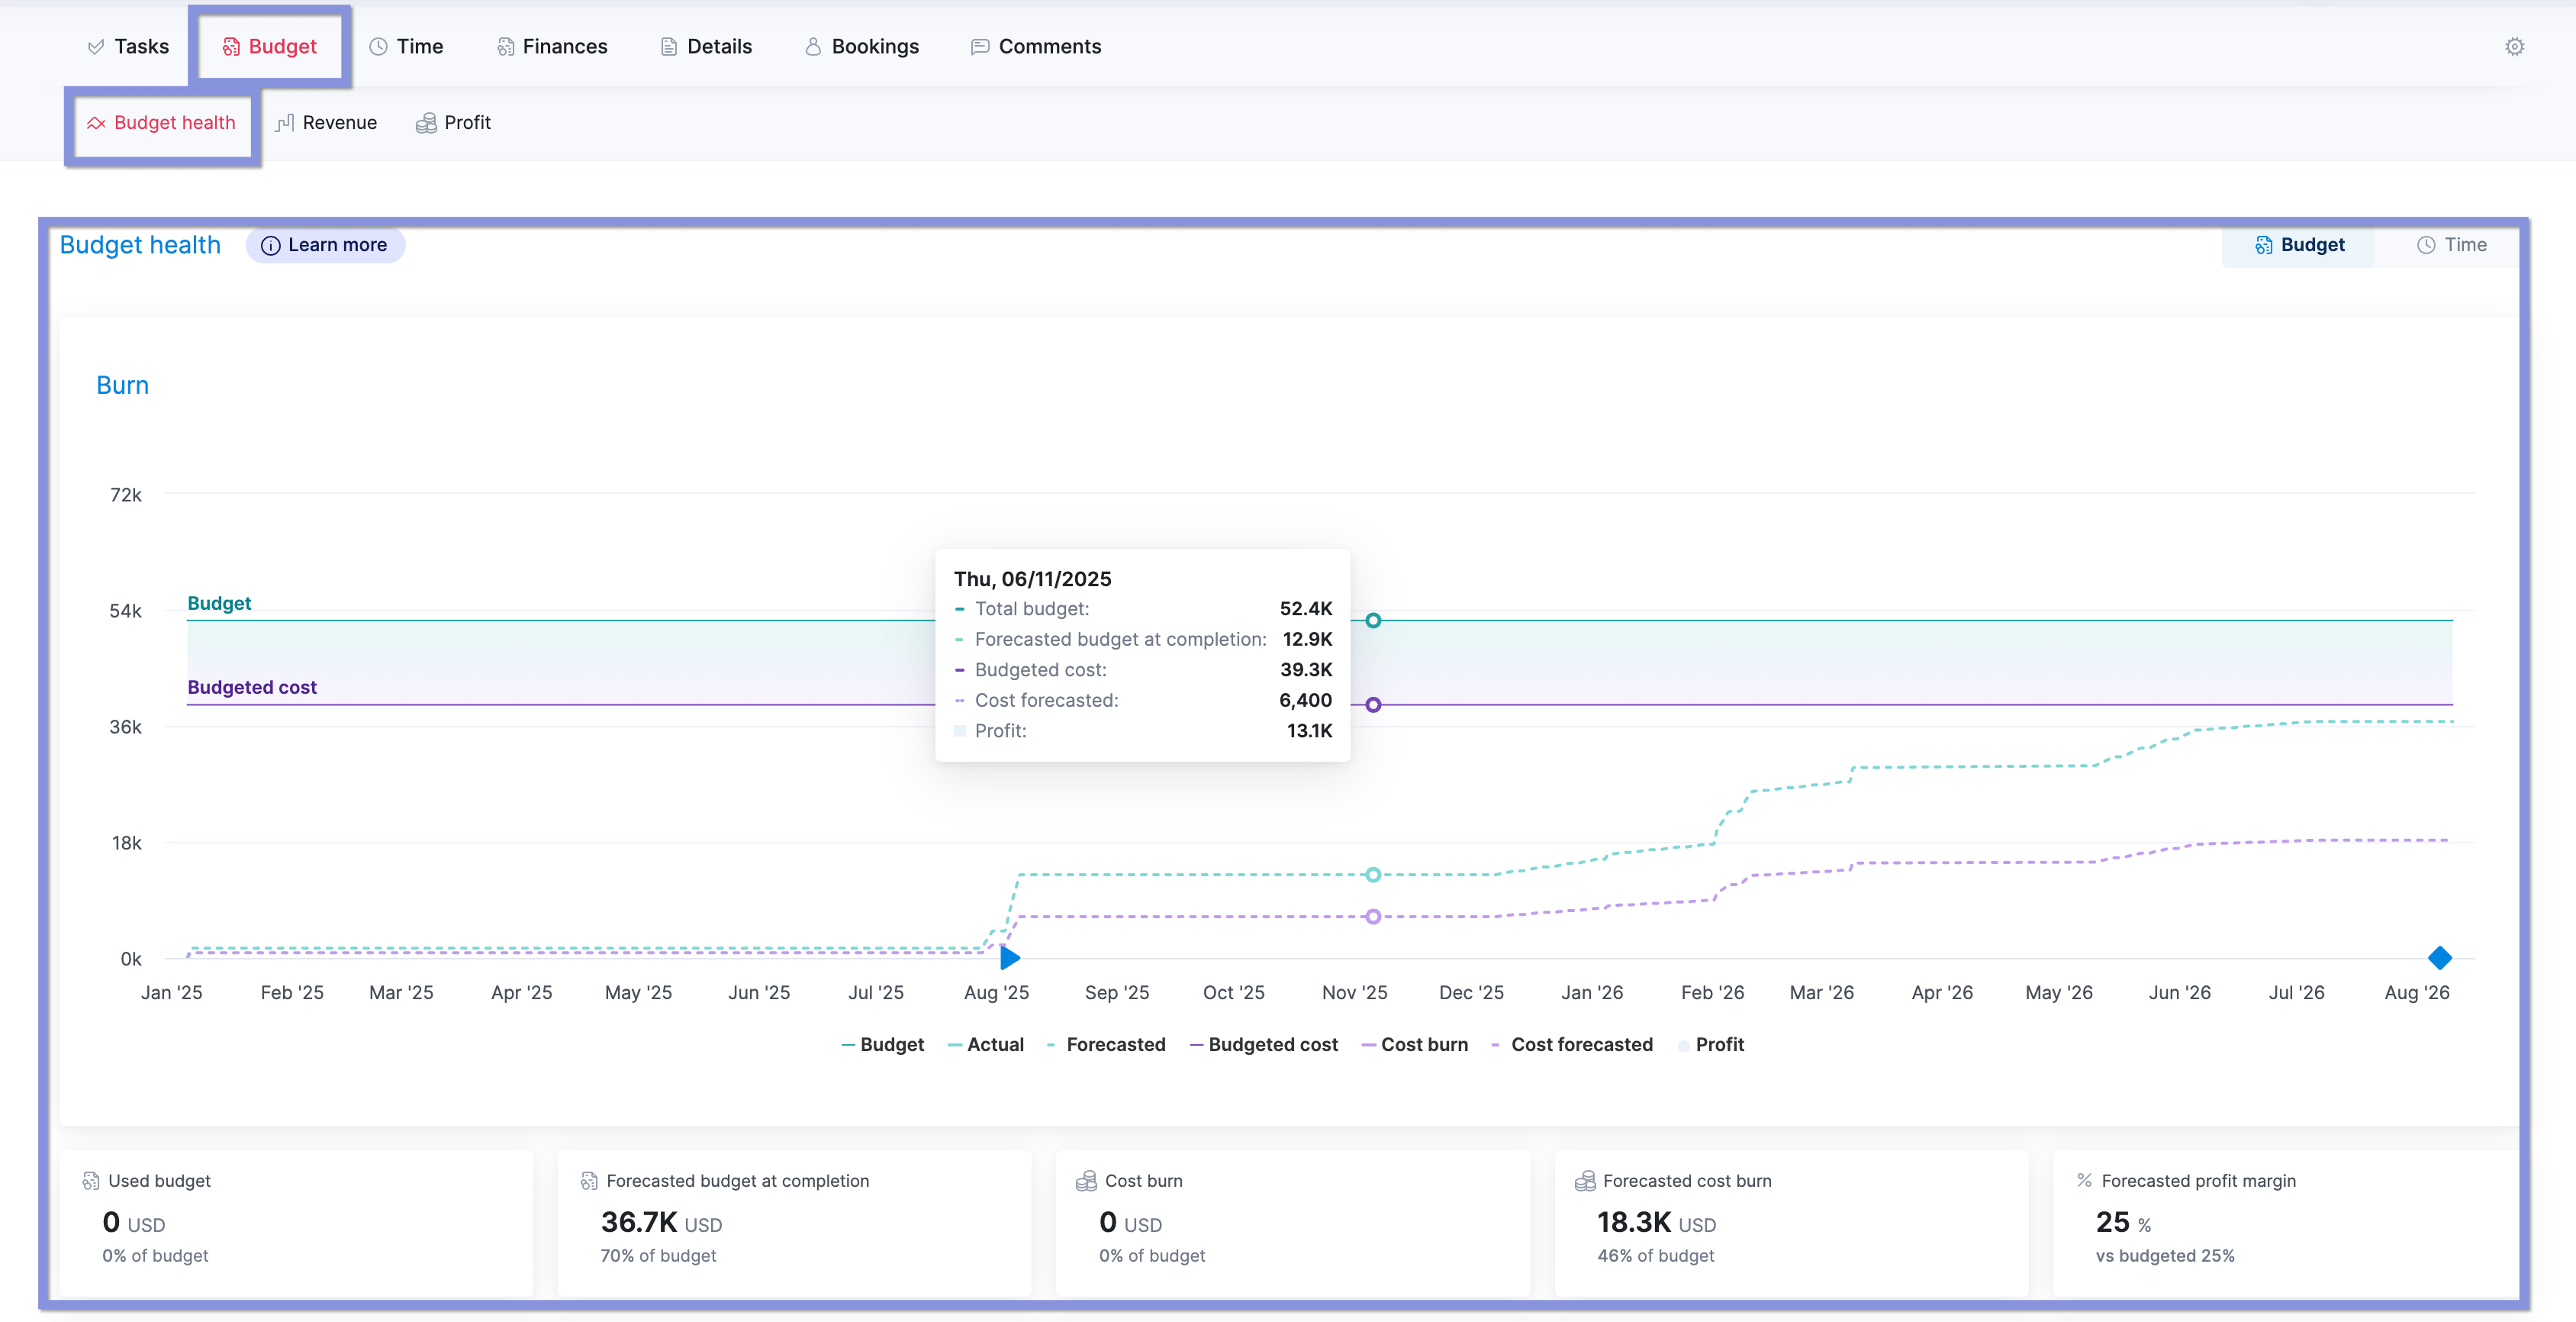
The “Breakdown” chart highlights where the budget is being spent, so you can quickly identify roles or services that are pushing costs beyond plan.
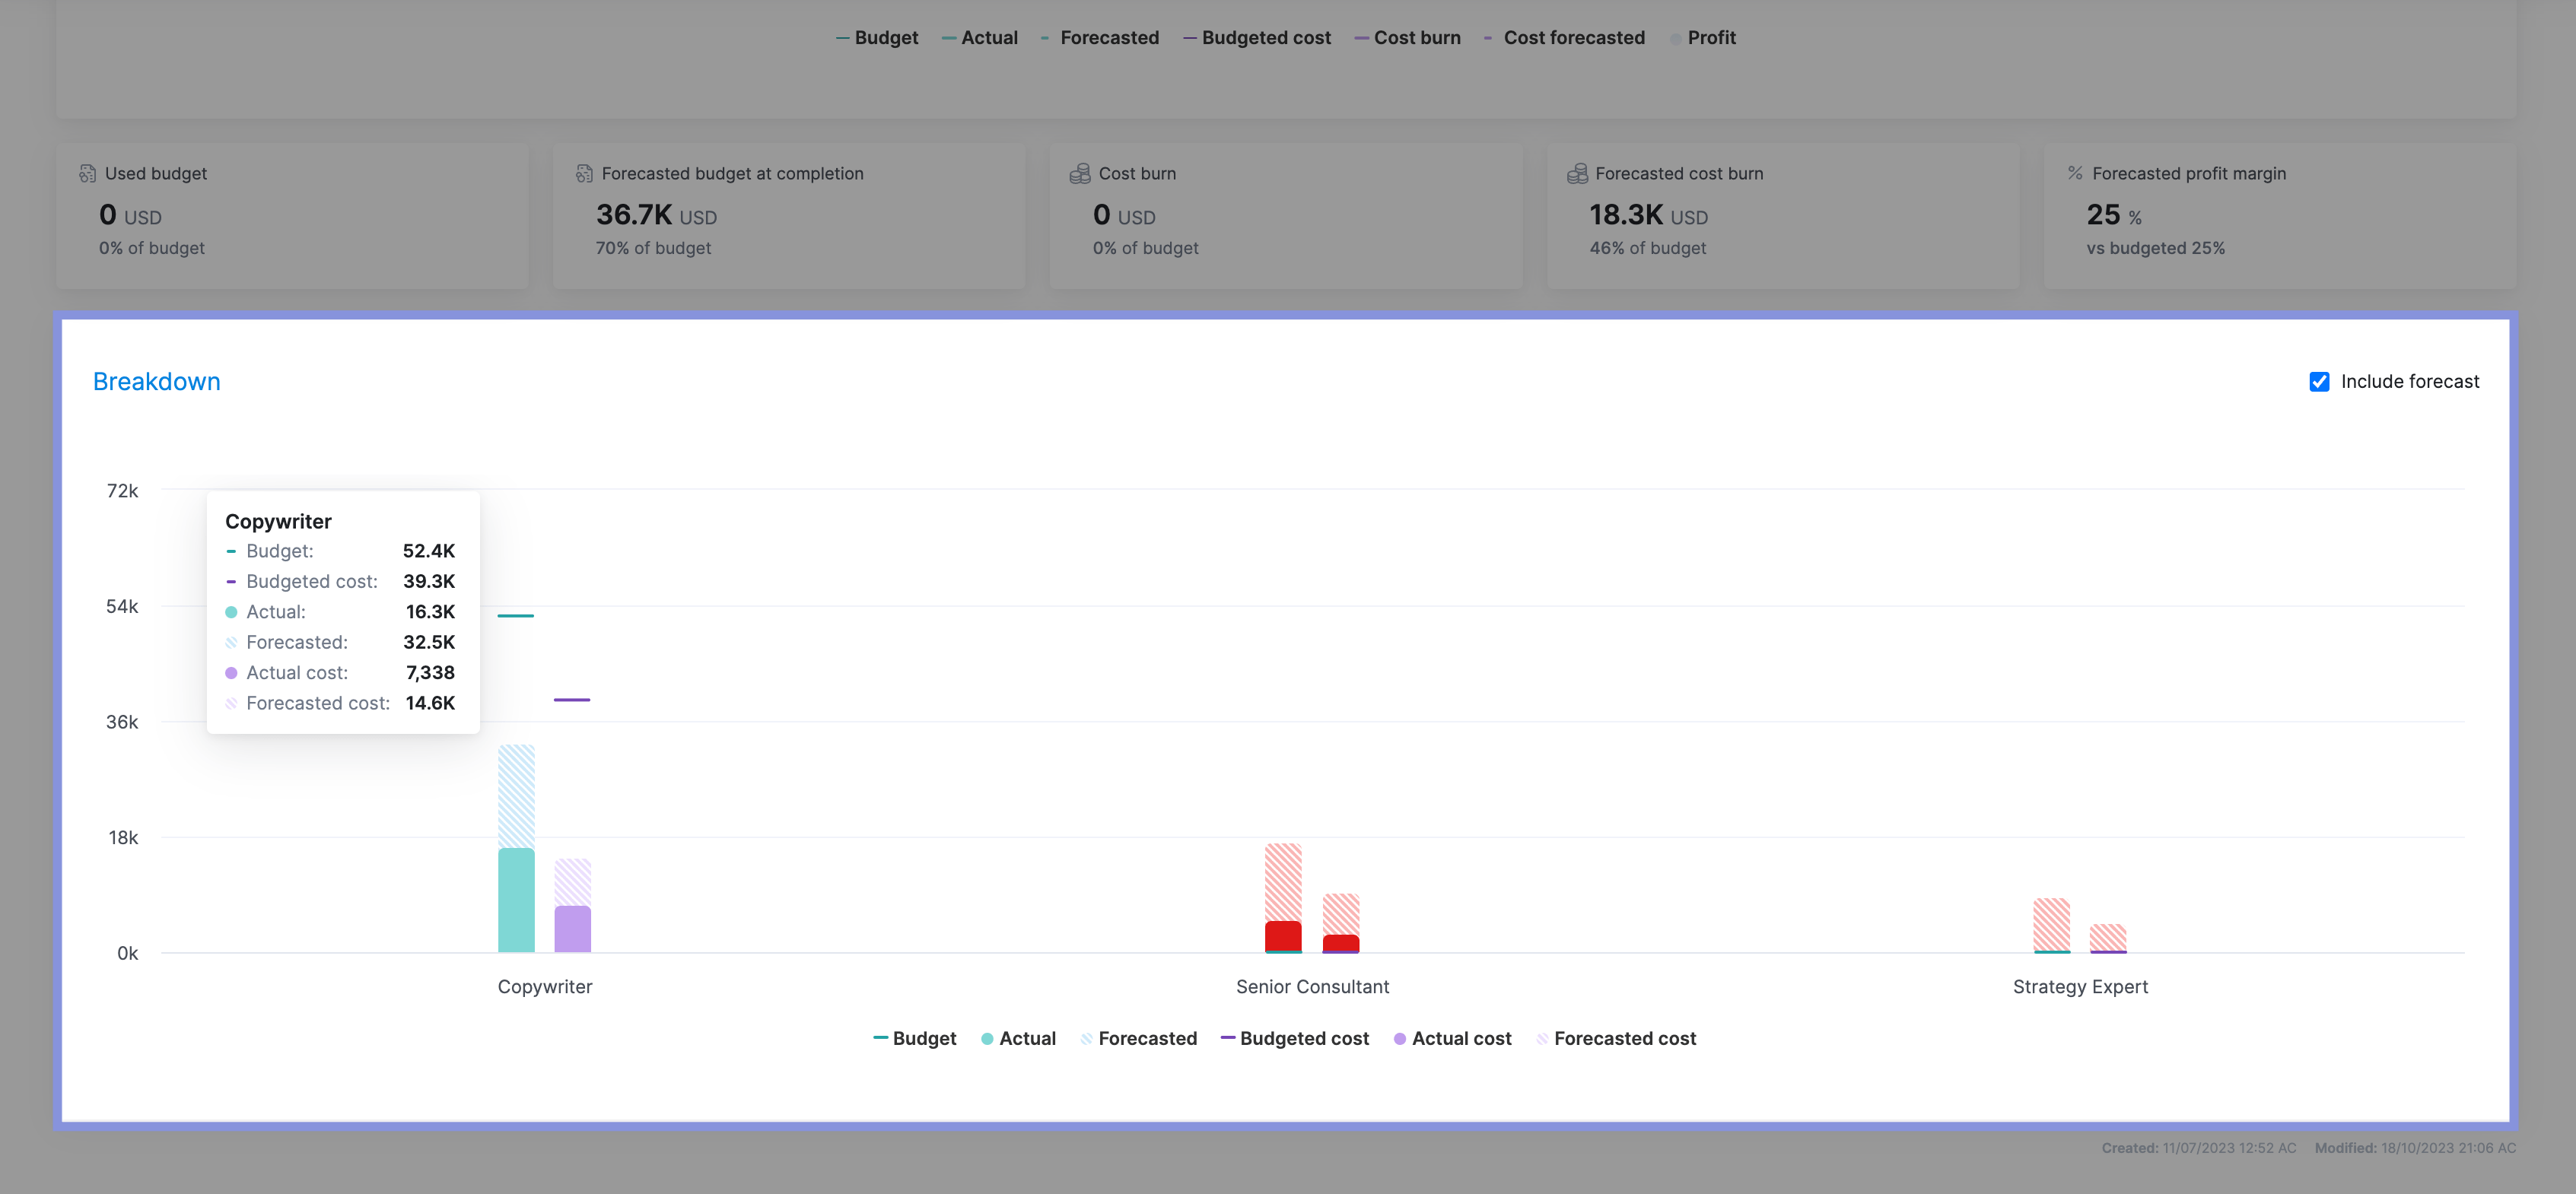
And the “Quoted vs Actual” table adds a deeper, line-by-line view—tracking hours, costs, revenue, and profit for each service or role against the original quote.
3. Billable vs. Non-Billable Hours
Billable vs. non-billable hours shows how much of your team’s time goes toward client work that generates revenue versus internal activities like meetings, training, and admin.
A healthy balance is key:
- Too much non-billable time: Leads to reduced revenue and lower profit margins, as team capacity is spent on work that can’t be billed to clients
- Too little non-billable time: Results in underinvestment in areas like employee training, process improvement, and strategic planning. Hurting long-term growth and team development.
Tracking billable vs. non-billable time helps agencies improve productivity while making sure there’s room for both client delivery and internal growth.
To be able to see how people put in their hours, complete their tasks, and record what they’re doing—it has really helped us understand how we use our resources and their availability.
The “Billable vs non-billable time by users” report in Scoro is designed to help you see how much time your team has spent on internal (non-billable) work versus client-facing (billable) tasks.
It’s a quick way to spot if too much time is going to admin work, so you can adjust priorities or reassign resources.
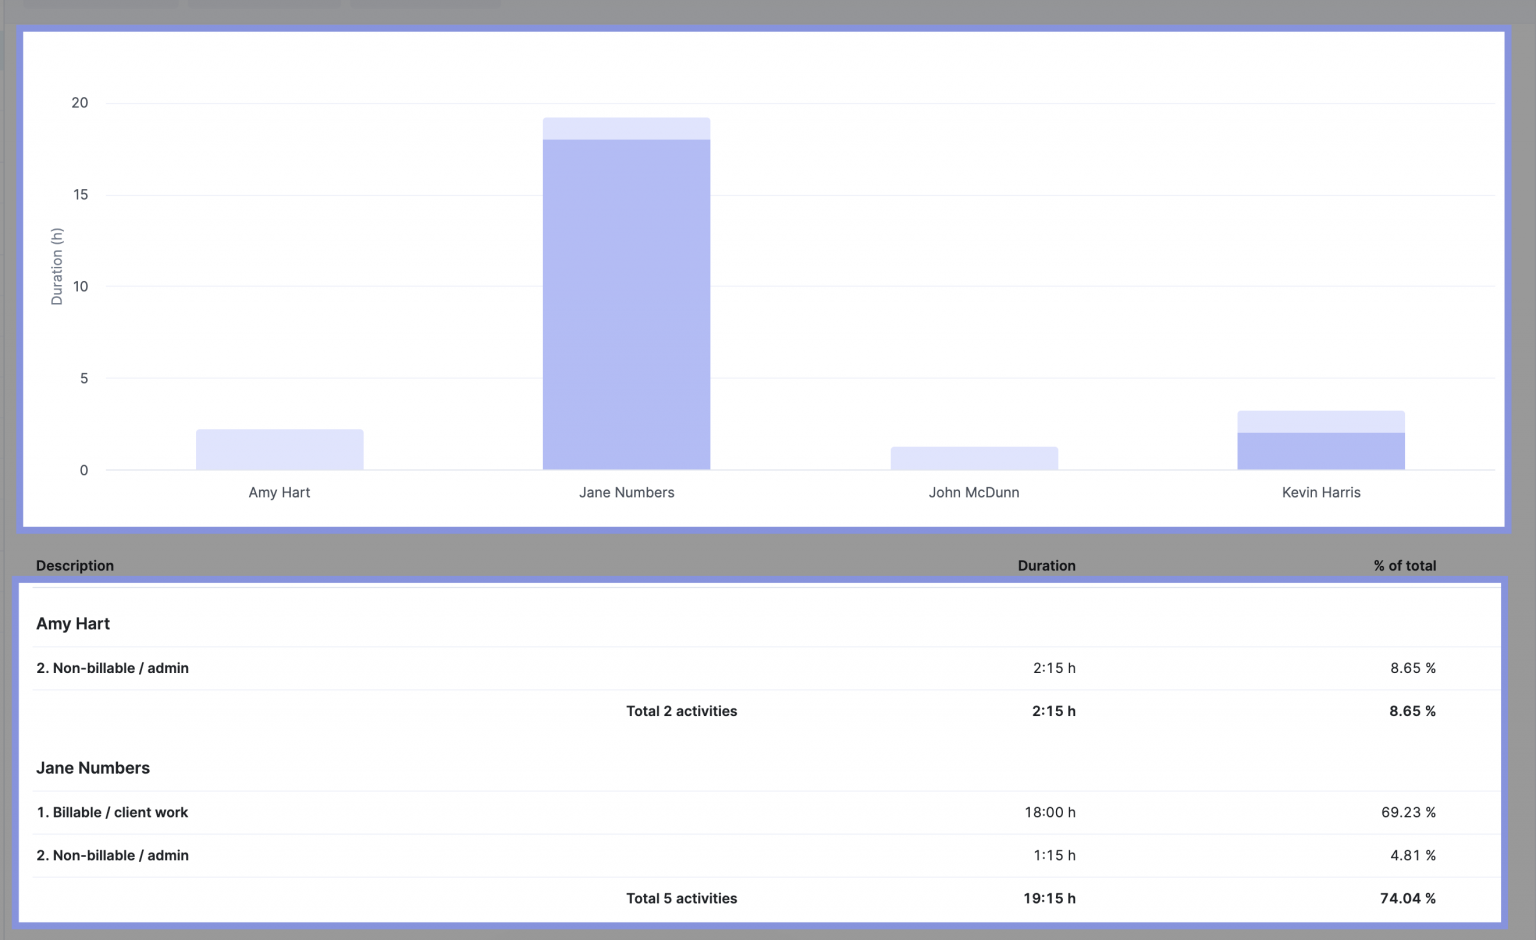
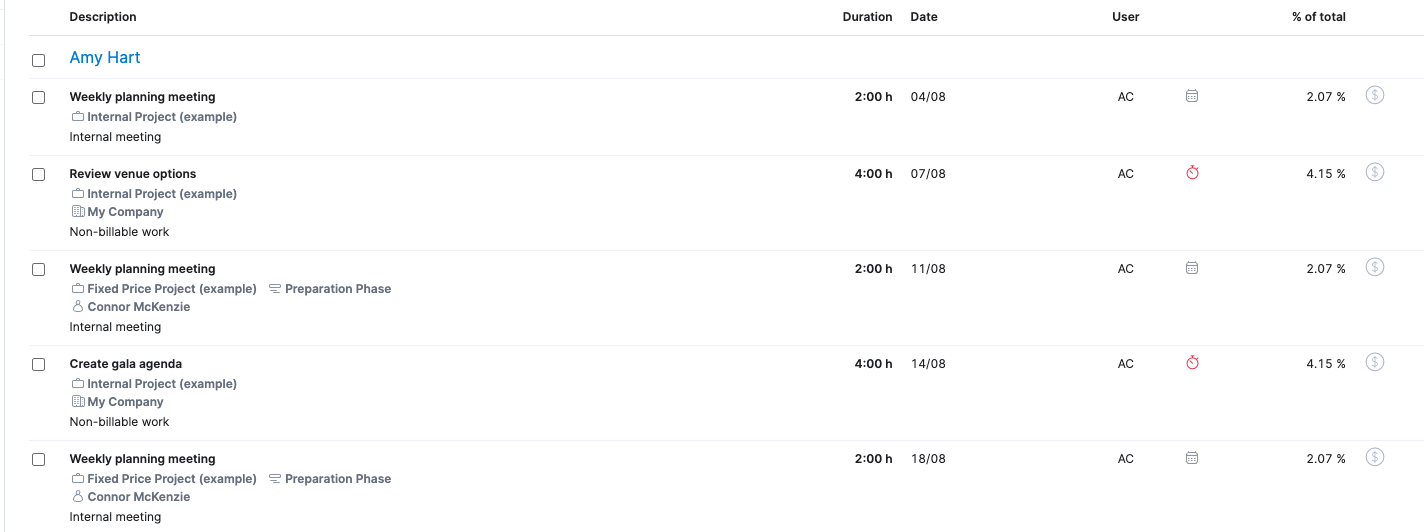
When you click on “Non-billable / admin” (or your chosen category for non-billable time) under any team member’s name.
This reveals a detailed breakdown of their non-billable tasks—whether it’s vacation, meetings, strategic business development, or low-value admin.
Top Tip
To generate this data, you’ll need to have activity types grouped into billable and non-billable categories. If that’s not set up yet, Scoro offers a step-by-step guide to help you organize your activity types for accurate tracking.
4. Invoicing & Payment Status
Tracking invoicing and payment status ensures your agency gets paid on time and maintains healthy cash flow.
If payments are delayed or overlooked, your agency can run into serious financial issues, including:
- Cover payroll: Creating financial stress for your team and risking turnover
- Pay suppliers on time: Which can damage relationships and delay projects
- Invest in growth: Making it harder to hire, upgrade tools, or scale operations
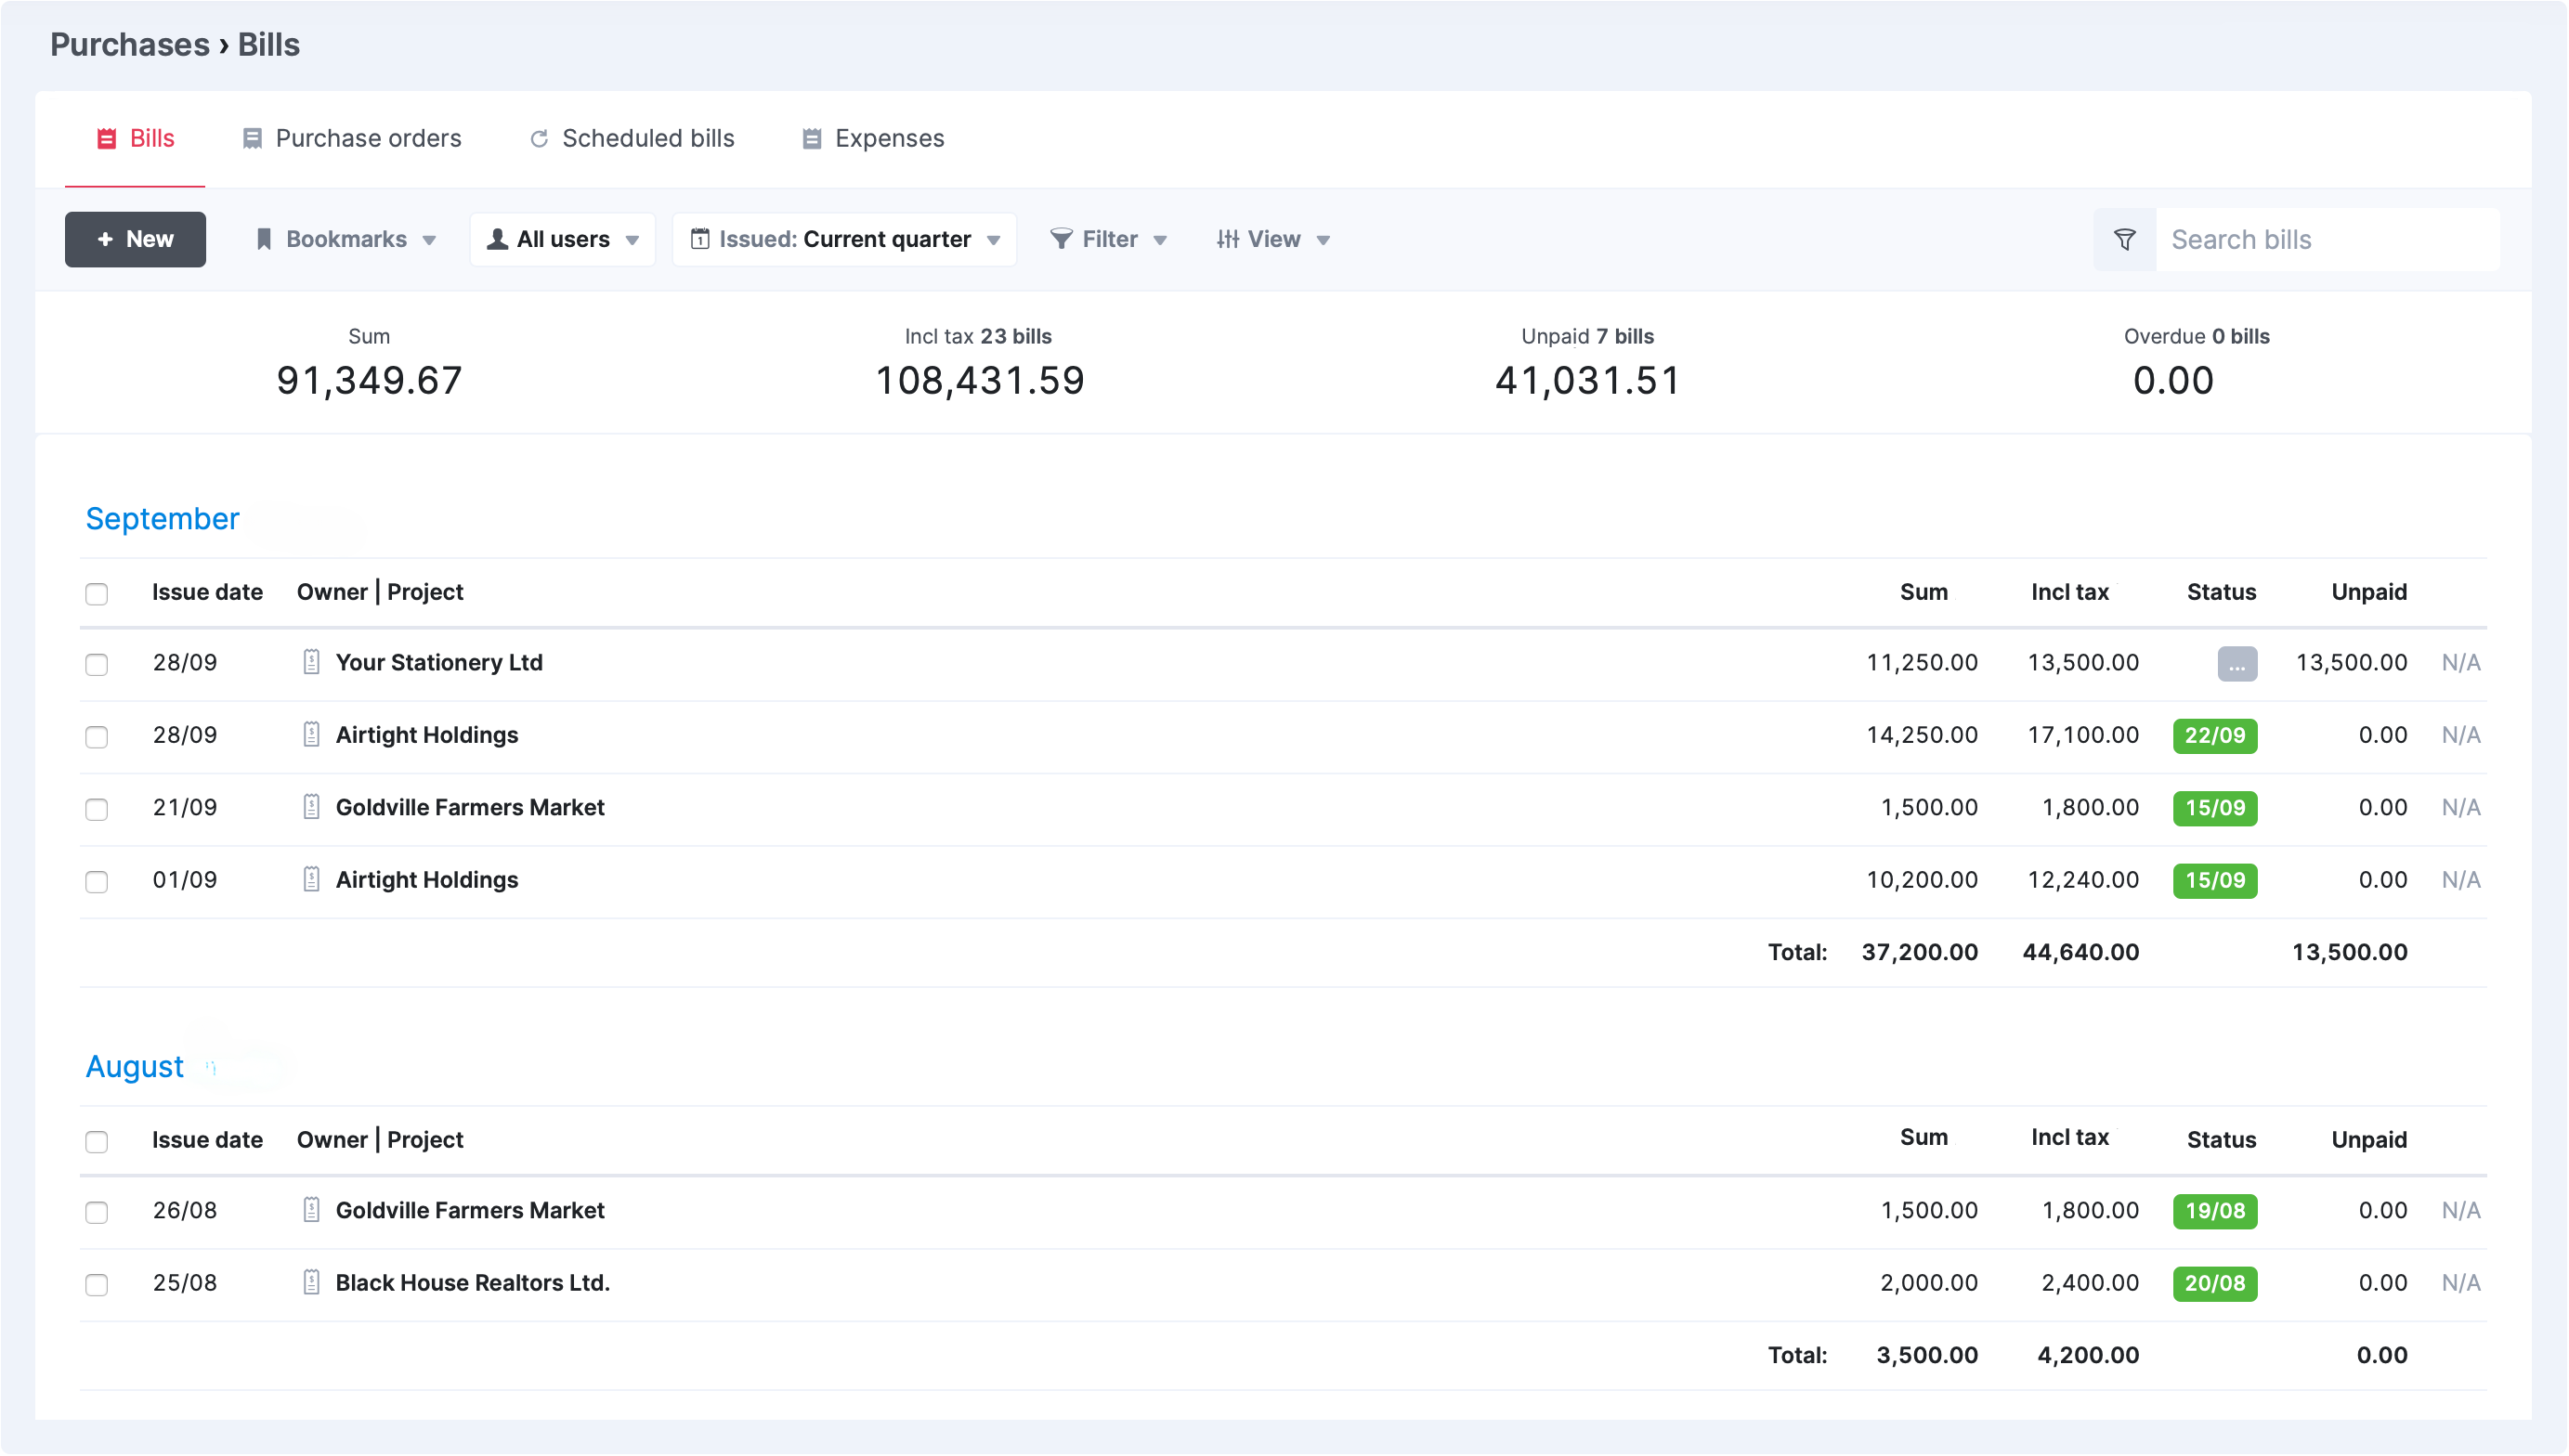
You can view a list of all your outstanding invoices in Scoro by looking at the “Invoice list” view.
The list can be filtered by projects, clients, payment methods, date ranges, and more.
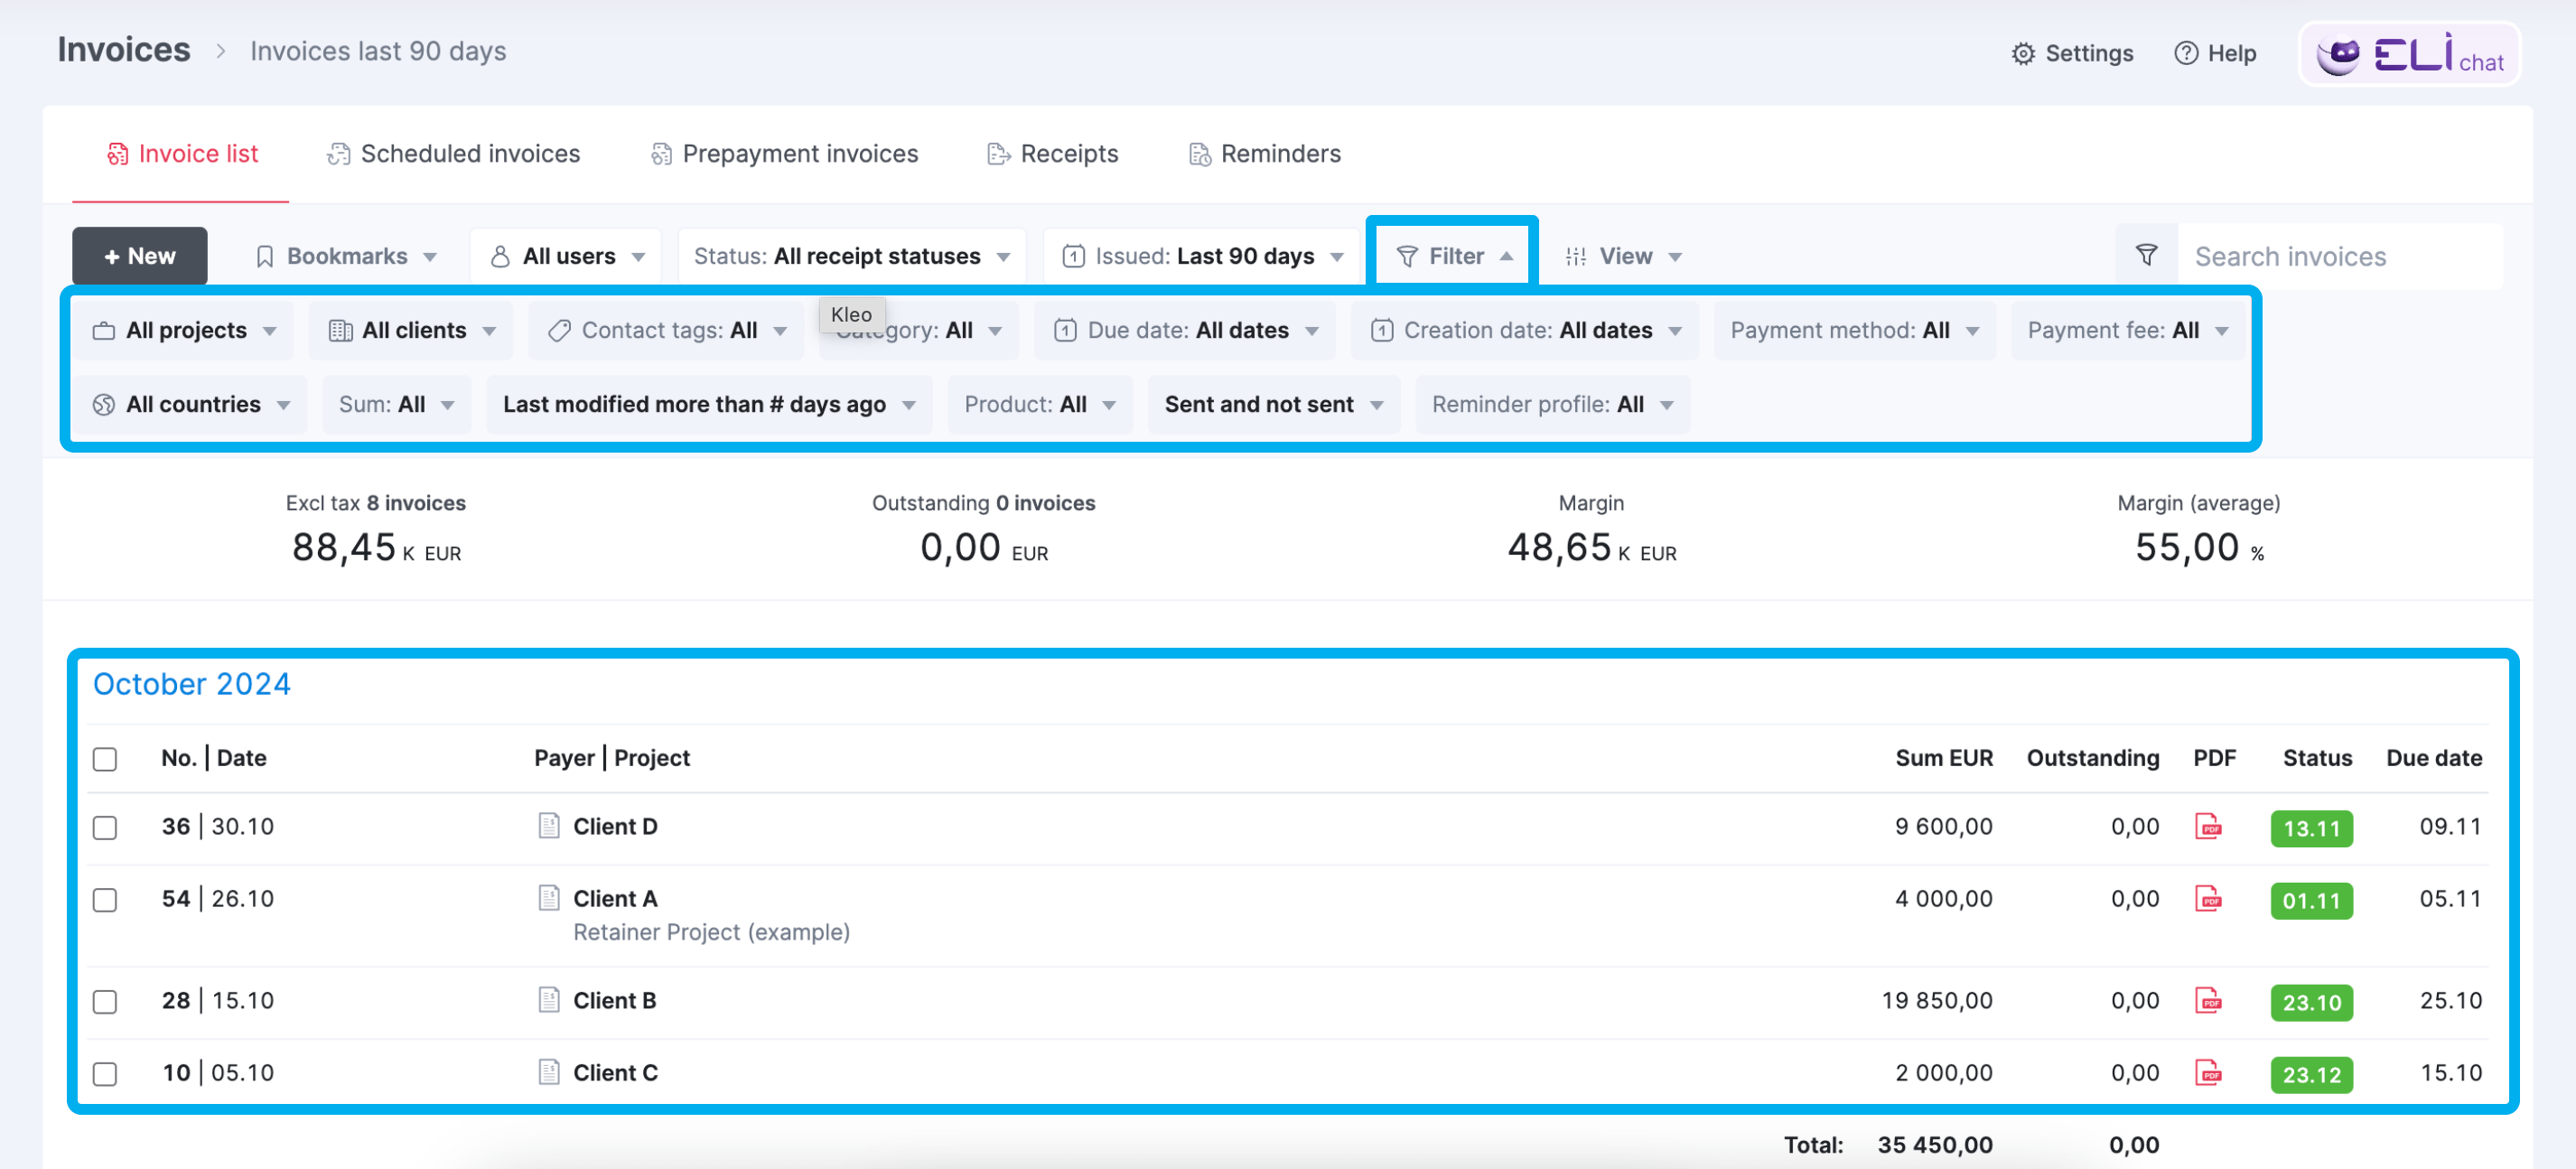
You can also hover the cursor over the payer’s name in the list and you’ll get a preview of the invoice.
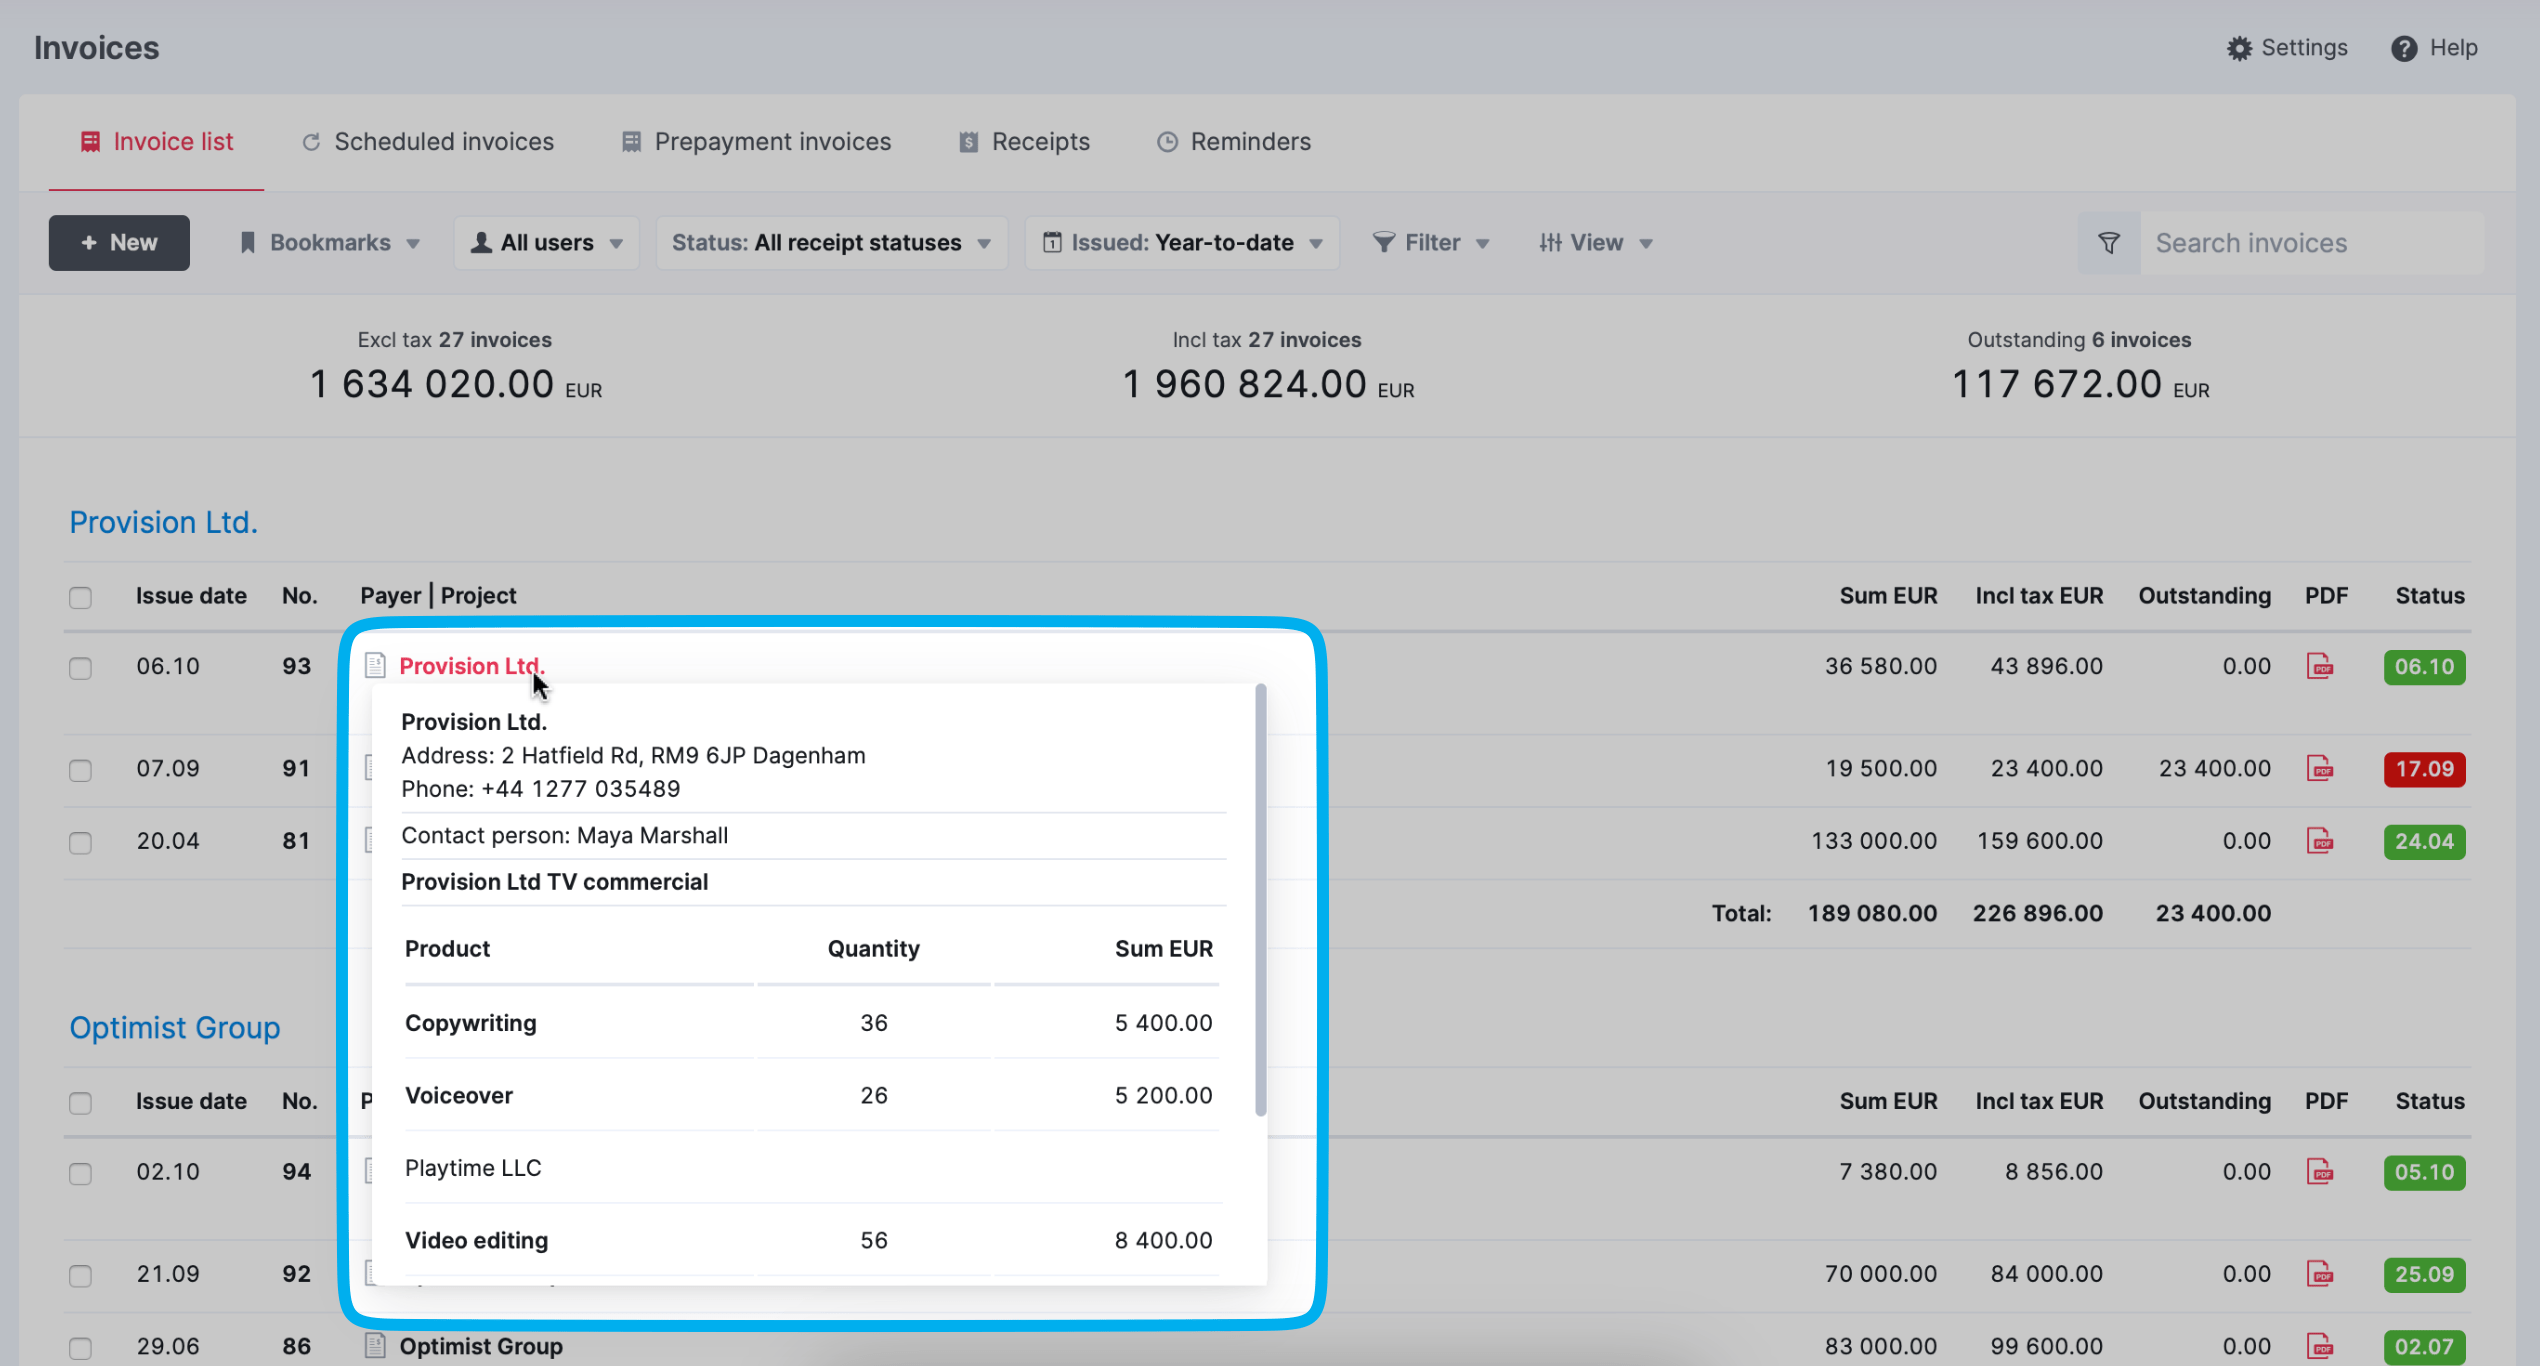
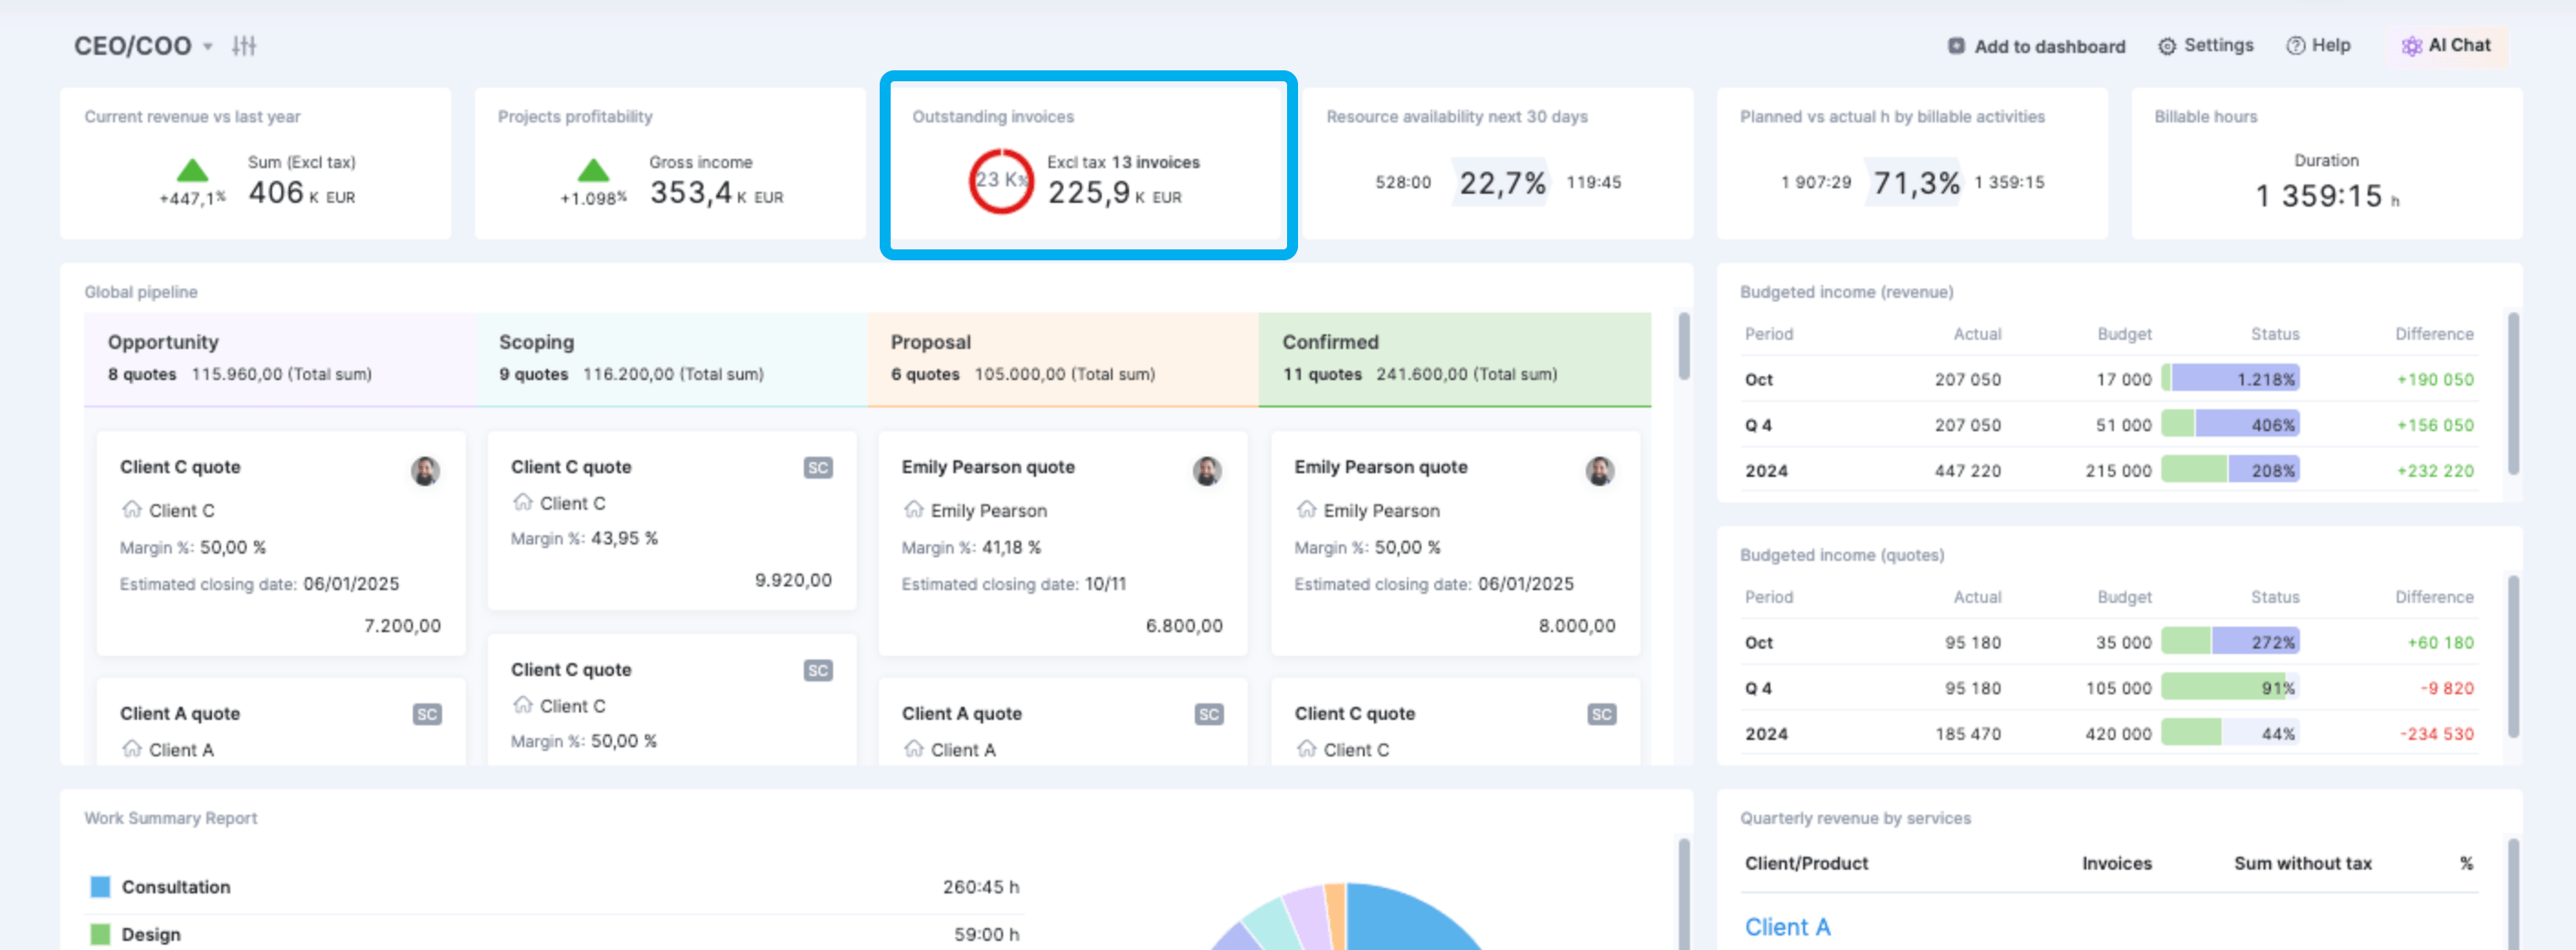
You can then pin that data to your dashboard for quick access to key invoice details.
Our cash flow has increased by at least 66% with Scoro because team members can invoice immediately upon completion. Faster invoicing means we spend less time on invoice queries, as the work is fresh in our clients’ minds.
5. Project Delivery Timelines
Project delivery timelines track how often projects are completed on schedule versus delayed.
When deadlines slip, the impact goes beyond client satisfaction. Costs rise, profitability drops, and your team ends up stretched thin.
You’ve likely seen it happen:
A project starts with a clear deadline, but scope changes, resource conflicts, or client delays slowly push things off track.
What starts as a one-week delay turns into a month of overrun.
The result?
- Unplanned hours cut into your profit
- Other projects are delayed, creating a domino effect
- The team rushes to finish, leading to rework and frustration
If you’re tracking project progress in real time, you can flag risks early. Giving you a chance to adjust timelines, renegotiate scope, or reallocate resources before things go off track.
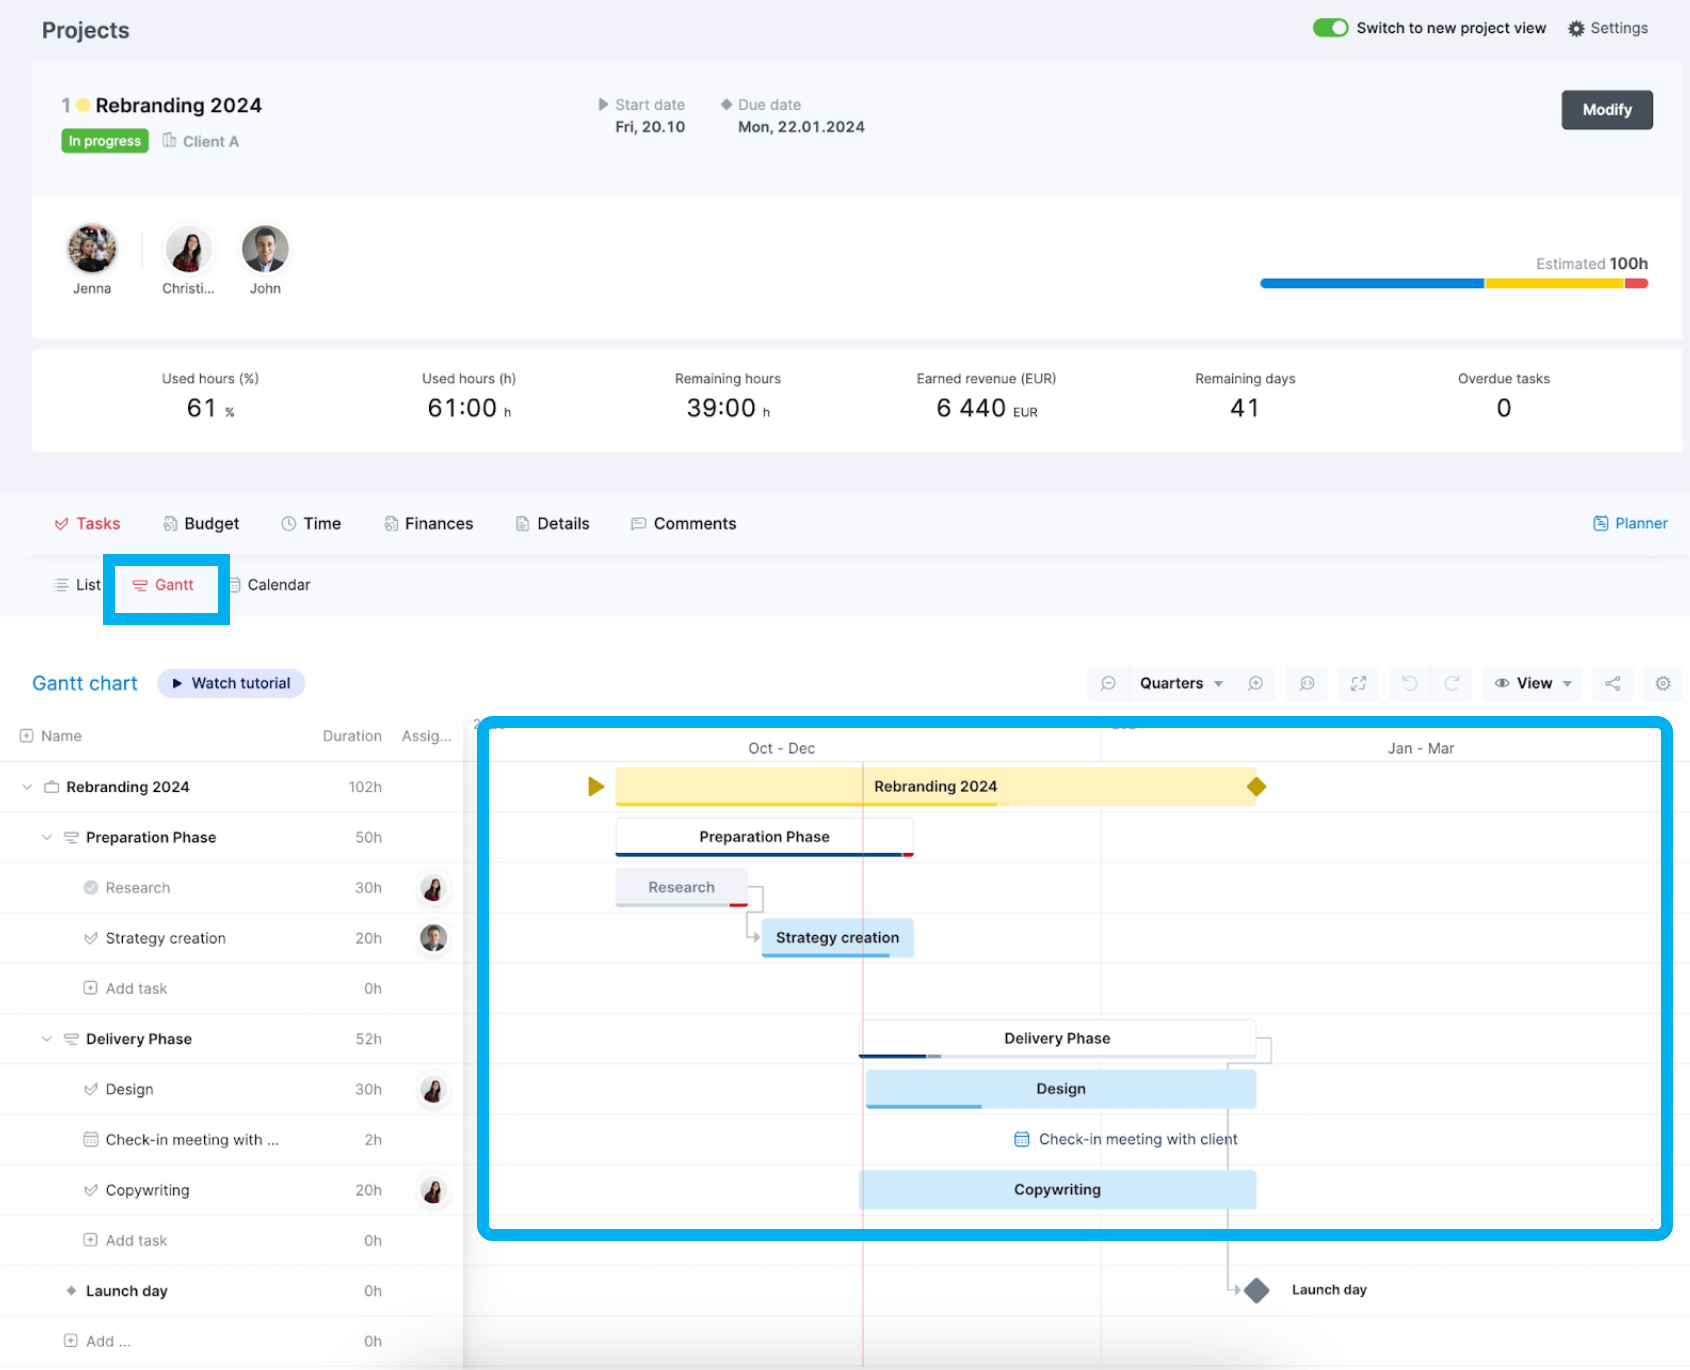
The Gantt chart in Scoro is your most powerful tool for managing delivery timelines.
It gives you a live, visual overview of the entire project—making it easy to plan, monitor, and make changes as needed.
With the Gantt chart, you can:
- Map out phases and milestones to structure your project clearly
- Set task dependencies so one delay doesn’t derail the whole plan
- Monitor progress vs. planned time using visual progress bars
- Identify bottlenecks early by seeing where tasks are slipping behind
- Reschedule dependent tasks automatically, based on availability
A red line marks today’s date, so you can instantly see what’s on track—and if anything shifts, simply drag and drop to update timelines. Scoro automatically adjusts related tasks and time entries, keeping your project moving smoothly.
6. Forecasted Capacity vs. Available Resource
Forecasting resources helps agencies predict workload, allocate resources effectively, and avoid last-minute scrambles. It’s not just about filling schedules—it’s about making sure the right people are working on the right projects at the right time.
Without clear forecasting, you risk:
- Overloaded teams: Missed deadlines and burnout
- Underutilized teams: Wasted payroll costs and lost revenue
- Last-minute hiring or rescheduling: Increased costs and operational inefficiencies
You’ve probably seen it happen:
A project pipeline that looked fine on paper quickly becomes unmanageable when delays or new requests pile up.
With accurate forecasting, you can spot upcoming workload spikes, shift resources in advance, and keep delivery smooth without overloading your team.
In Scoro, the portfolio-level “Bookings” view helps with forecasting by giving you a forward-looking, real-time picture of team capacity across all projects.
Here’s how it supports accurate forecasting:
- Visualize future workload: See what’s coming up in the next days, weeks, or months—based on confirmed tasks and tentative plans
- Spot resource gaps early: Group the view by roles (like Designer or Developer) or individuals to compare scheduled hours against availability. Utilization rates update instantly, showing who’s under or overbooked.
- Layer in tentative work: Use tentative entries to factor in upcoming or unconfirmed projects. They don’t commit resources, but they show how new work could impact capacity if it moves forward.
- Use heatmaps for quick insights: Color-coded indicators (green = available, red = overbooked) highlight pressure points at a glance.
Scoro’s gives us real-time insights into resource utilization and capacity across our entire business. We now make proactive, data-driven decisions.
7. Revenue vs. Targets
Tracking actual revenue against your financial goals helps ensure your agency stays on course for growth and profitability.
If revenue falls behind your targets, it may point to:
- Underpricing or scope creep → Too much work for too little revenue
- Low win rates → Not enough new business coming in to sustain growth
- Operational inefficiencies → Resources (your team) aren’t being used effectively, cutting into profit
For example, imagine your quarterly target is $500,000.
But by the start of the final month, you’ve only brought in $350,000.
If you’re not tracking revenue in real time, you might not notice the gap until the quarter is over (when it’s too late to act).
With real-time revenue tracking, you can:
- Spot shortfalls early and focus on high-value projects or upsells
- Push slow-moving deals in the pipeline to close
- Adjust pricing or team allocation to maximize profit on remaining work
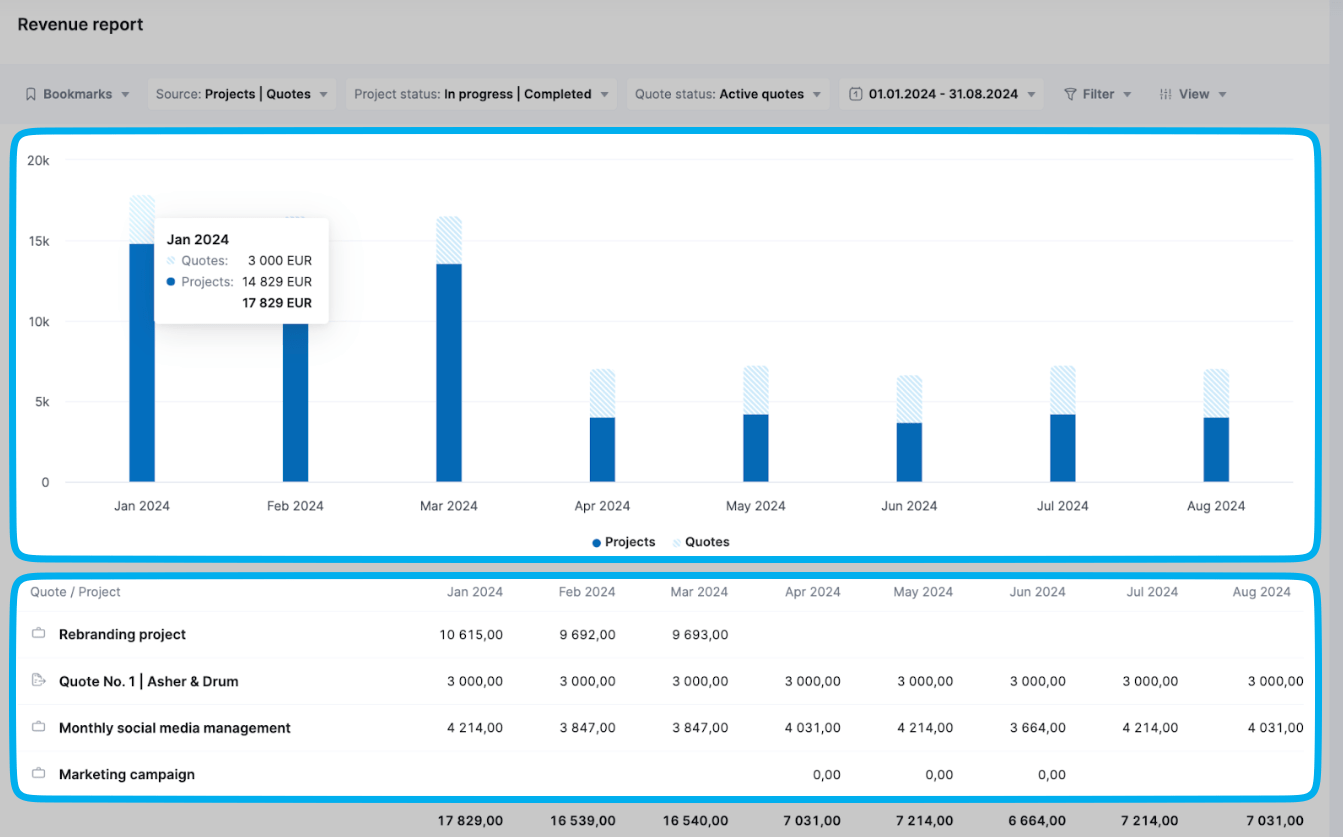
In Scoro, the “Revenue Report” gives you a live view of your agency’s performance—based on both confirmed project revenue and quotes in progress.
While it doesn’t set your revenue targets for you, once you define them, this report makes it easy to track progress and take action before it’s too late.
Here’s how:
- Track confirmed and forecasted revenue in real time, grouped by client, project, or responsible team member
- Filter by active projects or quotes to see guaranteed vs. potential income
- Use weighted values to forecast revenue based on probability of deal closure
- Spot gaps early so you can reprioritize, push deals forward, or adjust your pricing strategy
Scoro saves us at least two days of work every month on revenue forecasting. The live data means we don’t need to prep for meetings. We just open Scoro and access the reports, which are up to date and reliable.
Further reading:
- How to Forecast Revenue: A Guide for Professional Services
- Revenue Recognition: A Guide for Professional Services
8. Deal Win/Loss Ratio
Your win/loss ratio shows what percentage of proposals convert into signed projects.
A key indicator of how effective your sales process really is.
A low win rate can signal:
- Uncompetitive pricing or weak positioning: Clients may see better value elsewhere
- Inefficient sales processes: Leads take too long to convert or go cold
- Misalignment between sales and delivery: Projects aren’t scoped effectively, leading to lost deals
For example, if you send out 10 proposals per month and only 3 become signed projects, that’s a 30% win rate. Without tracking why you’re losing deals, you risk repeating the same mistakes.
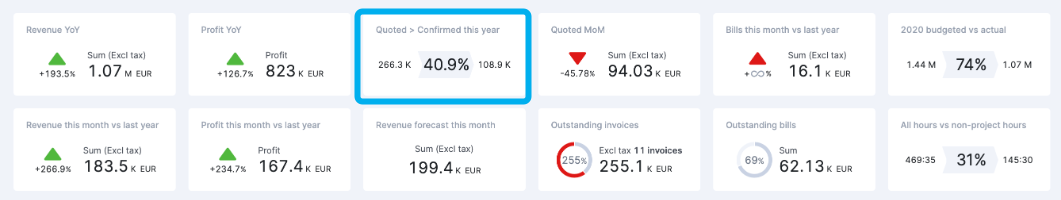
In Scoro, you can add a custom widget to your dashboard that displays your conversion rate from quoted proposals to confirmed projects.
9. Client Profitability
Client profitability shows how much return each client delivers relative to the time, effort, and resources they consume.
Not all clients are created equal—some drive strong margins, while others drain your team with low-value work.
Focusing too much on unprofitable clients can:
- Overload your team with high-effort, low-margin work
- Lower your overall profitability, even if revenue looks strong
- Prevent you from investing in high-value clients who bring better long-term growth
You’ve likely seen this firsthand:
A client who seemed promising at first but ended up demanding extra revisions, meetings, and support.
The budget didn’t reflect the real workload, your team spent double the expected time, and other projects fell behind.
But by tracking client profitability, you can:
- Spot red flags early and adjust pricing or scope
- Reallocate resources to higher-value accounts
- Refine your ideal client profile to focus on those who fuel sustainable growth
In Scoro, you can analyze project profitability by service type and client.
For example, head to the “Project list” view, filter for “Completed projects“, and group them by “Clients” to see which accounts consistently deliver the strongest margins.
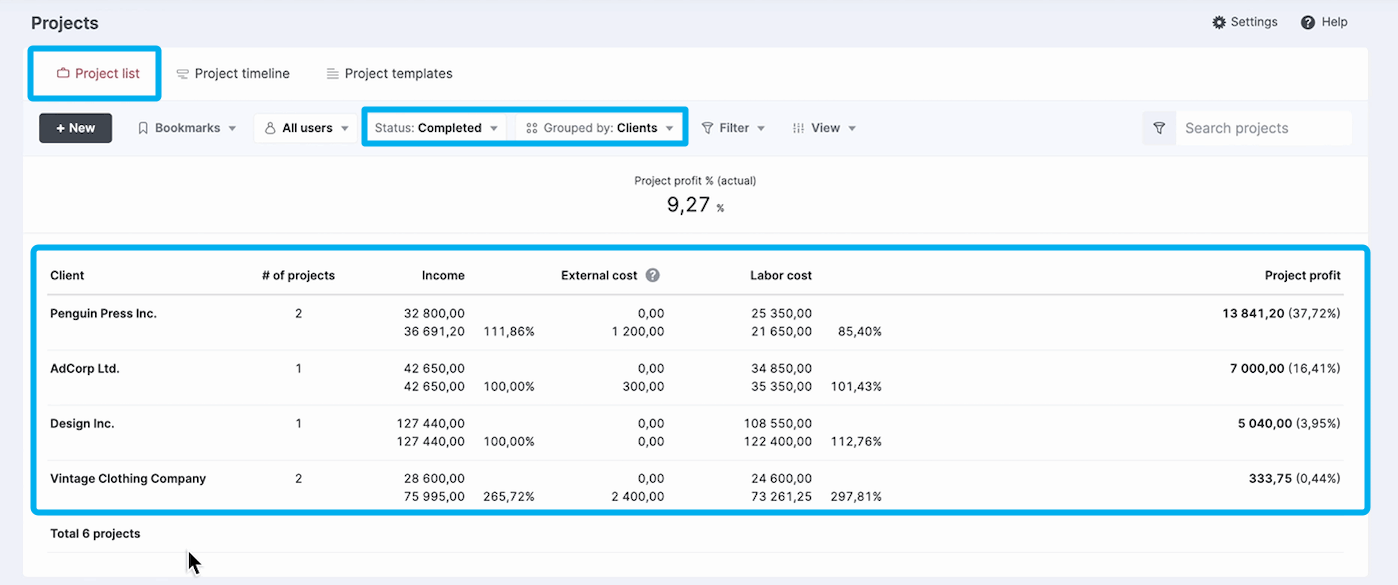
The control over the quality of our service has more than doubled, which has resulted in increased efficiency and profitability.
10. Supplier & Cost Management
Tracking external expenses, purchase orders, and supplier costs is essential to keeping projects profitable—regardless of how strong your revenue is.
Without real-time visibility, you risk:
- Unmonitored expenses: Bills add up, reducing project profitability.
- Inefficient supplier choices: Paying more than necessary for outsourced work or services.
- Budget overruns: Unexpected costs that make projects less profitable than planned.
You’ve probably had a project where costs kept creeping up, but without real-time tracking, you didn’t notice until it was too late.
- A supplier increased their rates, but the project budget stayed the same
- A freelancer logged extra hours, cutting into your expected profit
- Software subscriptions and vendor fees went unnoticed, adding unnecessary expenses.
If you had been tracking supplier costs in real time, you could have negotiated better rates or switched to cost-effective alternatives before they impacted margins. Or, caught unnecessary expenses early and adjusted spending to stay on budget.
In Scoro, you can stay on top of supplier costs with powerful tools for purchase and expense management:
- Raise purchase orders (POs): Gain upfront control over spending. You can even set up approval workflows to ensure every cost is reviewed and confirmed before it’s committed.
- Track actual costs through bills: With a dedicated bills list that includes customizable columns—so you can sort, filter, and analyze supplier spend in the way that works best for you.
- Get a complete overview: Of both committed and actual costs using the PO and bills lists—giving you a real-time view of your total supplier expenses across projects.