

Project burn rate measures how quickly you’re using your allocated budget within a given period.
Tracking it allows you to catch financial issues early—like extra overtime or unexpected expenses—so you can stay within budget.
For example, reallocating tasks from higher-paid senior staff to qualified junior team members can help prevent overspending before it becomes a problem.
Think of it like watching your fuel gauge—if you’re not paying attention, you might run out of gas (or in this case, money) before reaching your destination.
Take a web development project with a $100,000 budget planned over five months. If you don’t monitor burn rate closely, you might realize by month two that you’ve spent $30,000 instead of the planned $20,000—leaving only $40,000 for the remaining three months.
At that point, you’d need to either cut $10,000 from the remaining work or request additional project budget from the client.
However, tracking your burn rate weekly would allow you to spot overspending early and make adjustments before overrunning your budget.
Top Tip
Alfie Wenegieme—with 17+ years of commercial finance experience—breaks down the key financial metrics every business should track, common financial pitfalls, and strategies to improve your team’s financial understanding.
Watch the podcast episode now and take control of your financial future.

How to calculate your project burn rate
To find your project burn rate, just divide how much you’ve spent by your total budget to get a percentage.
Calculate your burn rate weekly, monthly, and at the end of the project to maintain a complete picture of your project’s financial health:
- Weekly burn rate: Highlight immediate spending patterns
Let’s continue with our five-month web development project example.
If you spent $5,000 in the first week of your $100,000 project, your weekly burn rate would be 5% ($5,000 ÷ $100,000 = 0.05 → 5%).
While this weekly rate keeps you on track for your five-month timeline, you might consider reducing next week’s spending to $4,000 to build a buffer against unexpected costs.
Managing your project budget early on is crucial—having extra cushion in your budget means you won’t face tough choices like reducing scope or requesting additional funding if surprises come up later.
- Monthly burn rate: Reveal sustained trends
If you spent $20,000 in month one, your monthly burn rate would be 20% ($20,000 ÷ $100,000 = 0.20 → 20%).
At this rate, your budget should last the planned five months—but to protect against surprises, consider setting aside 10-15% of your remaining budget as a contingency fund and identifying non-essential tasks you could scale back if needed..
- End-of-project burn rate: See how well you managed your finances
If you finish the project having spent $90,000, your overall burn rate would be 90% ($90,000 ÷ $100,000 = 0.90 → 90%).
This means you saved 10% and showed strong financial control. Congrats!
Factors that affect your burn rate
If you’re struggling to manage your project spending, start by looking at these four key factors that tend to have the greatest impact on burn rates:
If you’re struggling to control project spending, start by examining these four key factors that significantly affect your burn rate:
- Labor costs: Overtime and staffing choices directly influence your budget. For example, if a senior developer requires 30 hours instead of the planned 20 to resolve technical challenges—and charges $150/hour—that’s an extra $1,500 spent. Relying too heavily on senior staff instead of delegating tasks to lower-cost junior team members can quickly escalate costs.
- Bills and expenses: Irregular vendor and contractor payments can cause unexpected spikes in spending. For instance, if a design contractor submits their full invoice earlier than planned, your burn rate might jump to 40% when you had only accounted for 25% at that stage.
- Unplanned costs: Scope changes, client feature requests, or additional expenses (e.g., hiring freelancers) can disrupt your budget. Imagine a website migration project where discovering incompatible legacy systems requires bringing in a specialist—adding $5,000 in unforeseen costs and accelerating your burn rate.
- Lack of real-time cost visibility: Relying on manual expense tracking often means you don’t see the full financial picture until days or weeks later. By the time issues surface, you may already be off course and scrambling to adjust.
To prevent budget overruns, consider using automated budgeting software that provides real-time tracking, ensuring full visibility into labor costs and spending before approving new work.
Further reading: 10 Causes of Project Cost Overruns and How to Solve Them
7 best practices to control your project burn rate
The more projects you’re juggling, the more project burn rates you need to manage. And it can feel like a lot to balance.
Avoid feeling overwhelmed with these seven key tips to keep burn rates under control across your entire portfolio:
1. Build in a buffer for extra time and costs into your budget
Including a project buffer—extra time or money built into your initial budget—helps absorb unexpected costs and keeps your burn rate on track.
We recommend a buffer of 10% to 15% of the total budget.
However, higher-risk projects (like ones with new or complex deliverables) can warrant larger buffers to account for unknown variables. And ones that are more straightforward can usually rely on smaller buffers.
Say two team members logged extra hours during a project to address unexpected technical bugs. But since you included a 10% cost buffer in the original budget—increasing it from $100,000 to $110,000—your burn rate stayed stable despite $8,000 in extra work hours.
And while you privately addressed the quality issues with the team to prevent future problems, from the client’s perspective, the project ran smoothly and met their expectations—with no budget discussion needed.
Use hard data in Scoro’s “Quoted vs Actual” chart to figure out how big (or small) you need your buffer to be.
The dashboard shows how your estimated time and costs compare to what you actually used across different project phases, services, and tasks.
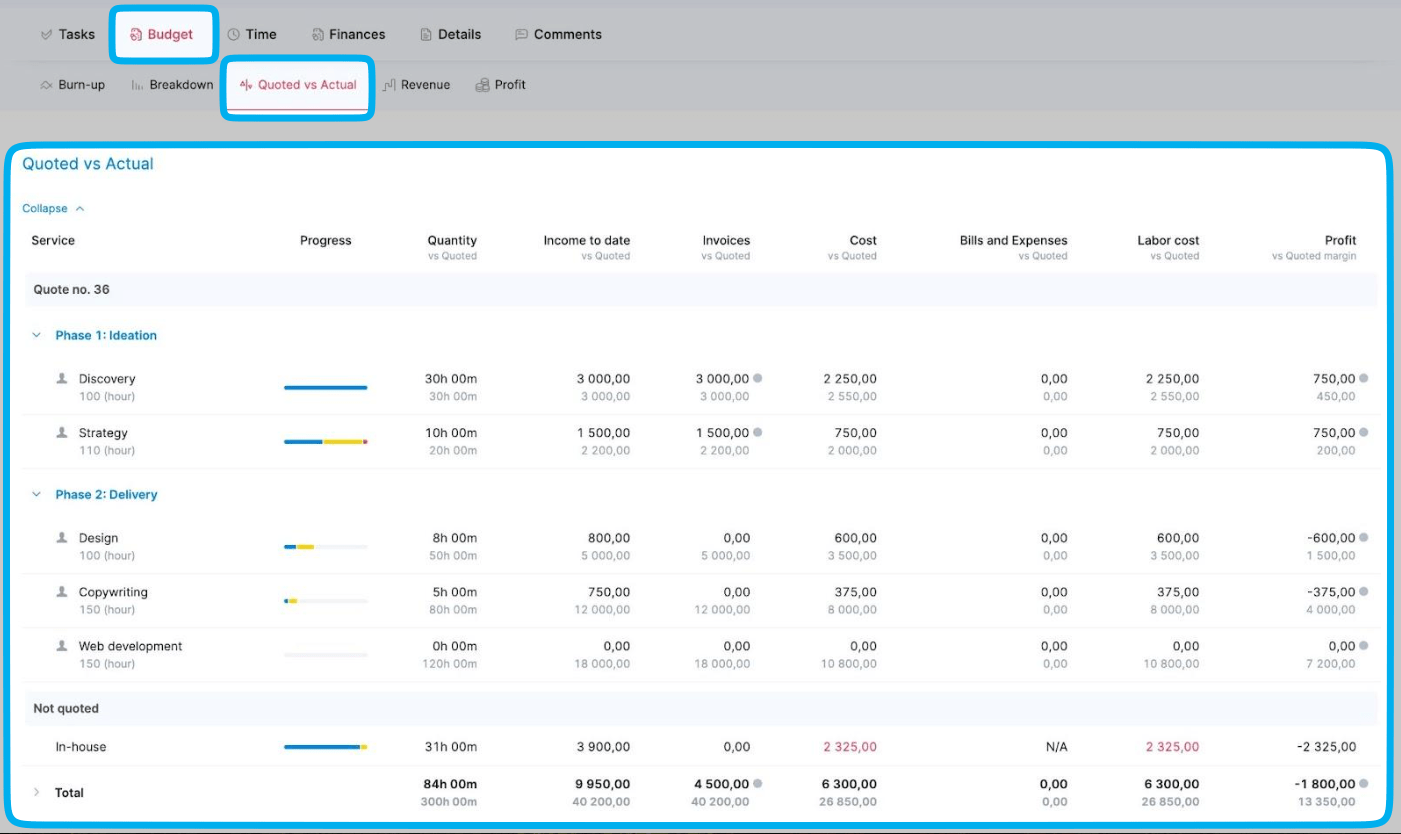
Using this historical data, you can refine your buffer calculations to be more precise and project specific.
For example, looking at the Discovery phase for this project, we can see the team used exactly the quoted time (30 hours actual vs 30 hours quoted) and quoted budget ($3,000):
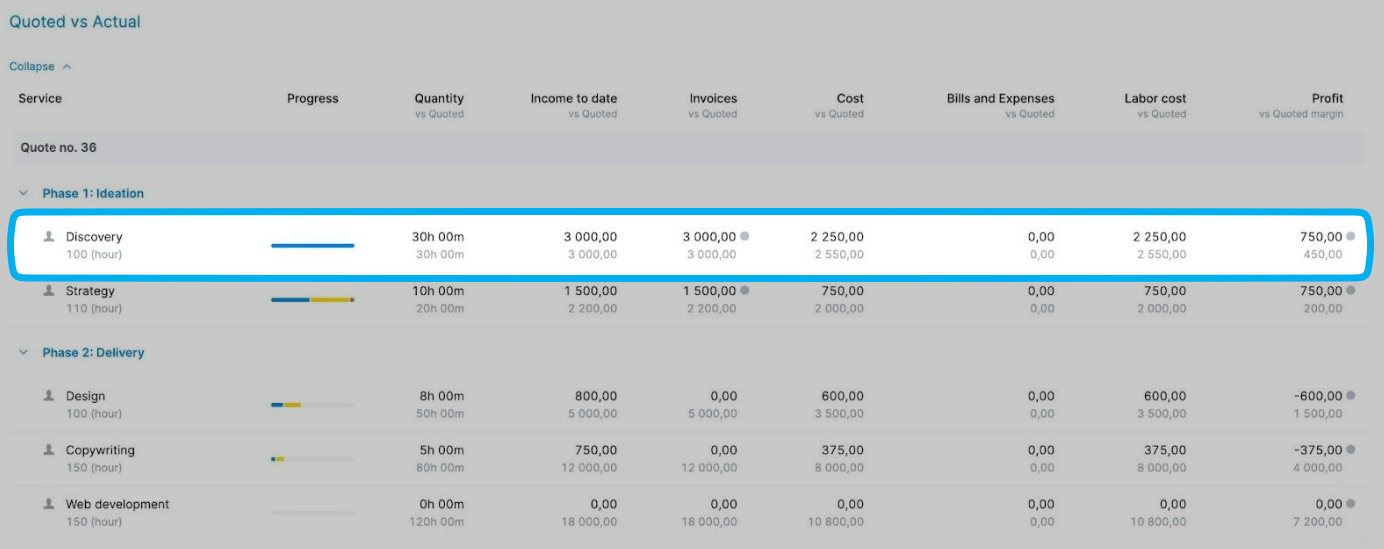
While they did stay within the timeframe and budget, it was a close call. So it would make sense to build small buffers for similar projects in the future. This way, you have some “wiggle room” if unexpected challenges come up.
2. Pay close attention to labor costs when scheduling assignments
Thoughtful resource scheduling can mean the difference between staying within your budget or burning through it too quickly.
Why?
Because labor costs make up a significant portion of project budgets. Unlike one-time expenses like software licenses, these costs accumulate daily as your team works on the project.
Take a three-month app development project:
You originally scheduled a senior developer to handle all user interface (UI) updates at $150/hour for 100 hours ($15,000 total).
But after reviewing your resource planning chart, you see that a junior developer with a $75/hour rate has similar availability.
By shifting 40 hours of basic UI tasks to the junior developer, you reduce costs by $3,000 while keeping the project on track.
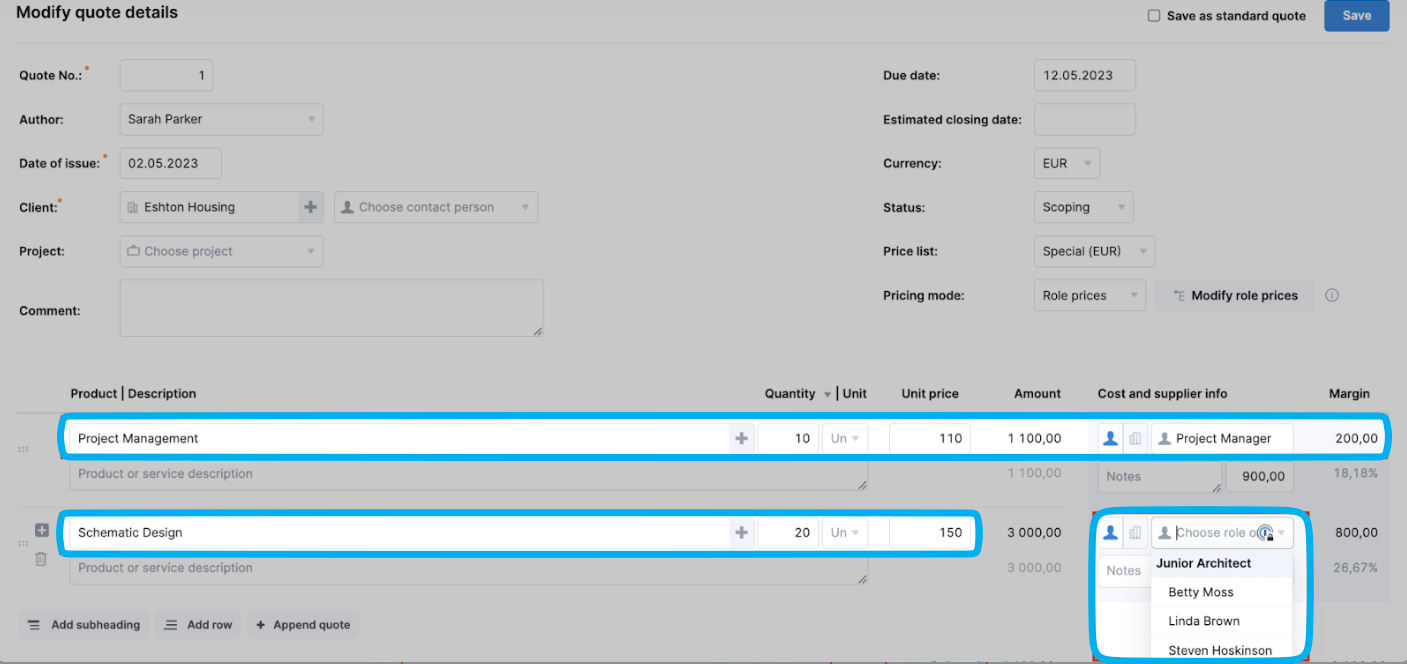
With Scoro’s pre-set individual and role-based rates, comparing the financial impact of different staffing decisions is easy.
Just go to “Settings” > “Work and projects” > “Labor cost” to enter your team’s rates and optimize your budget.
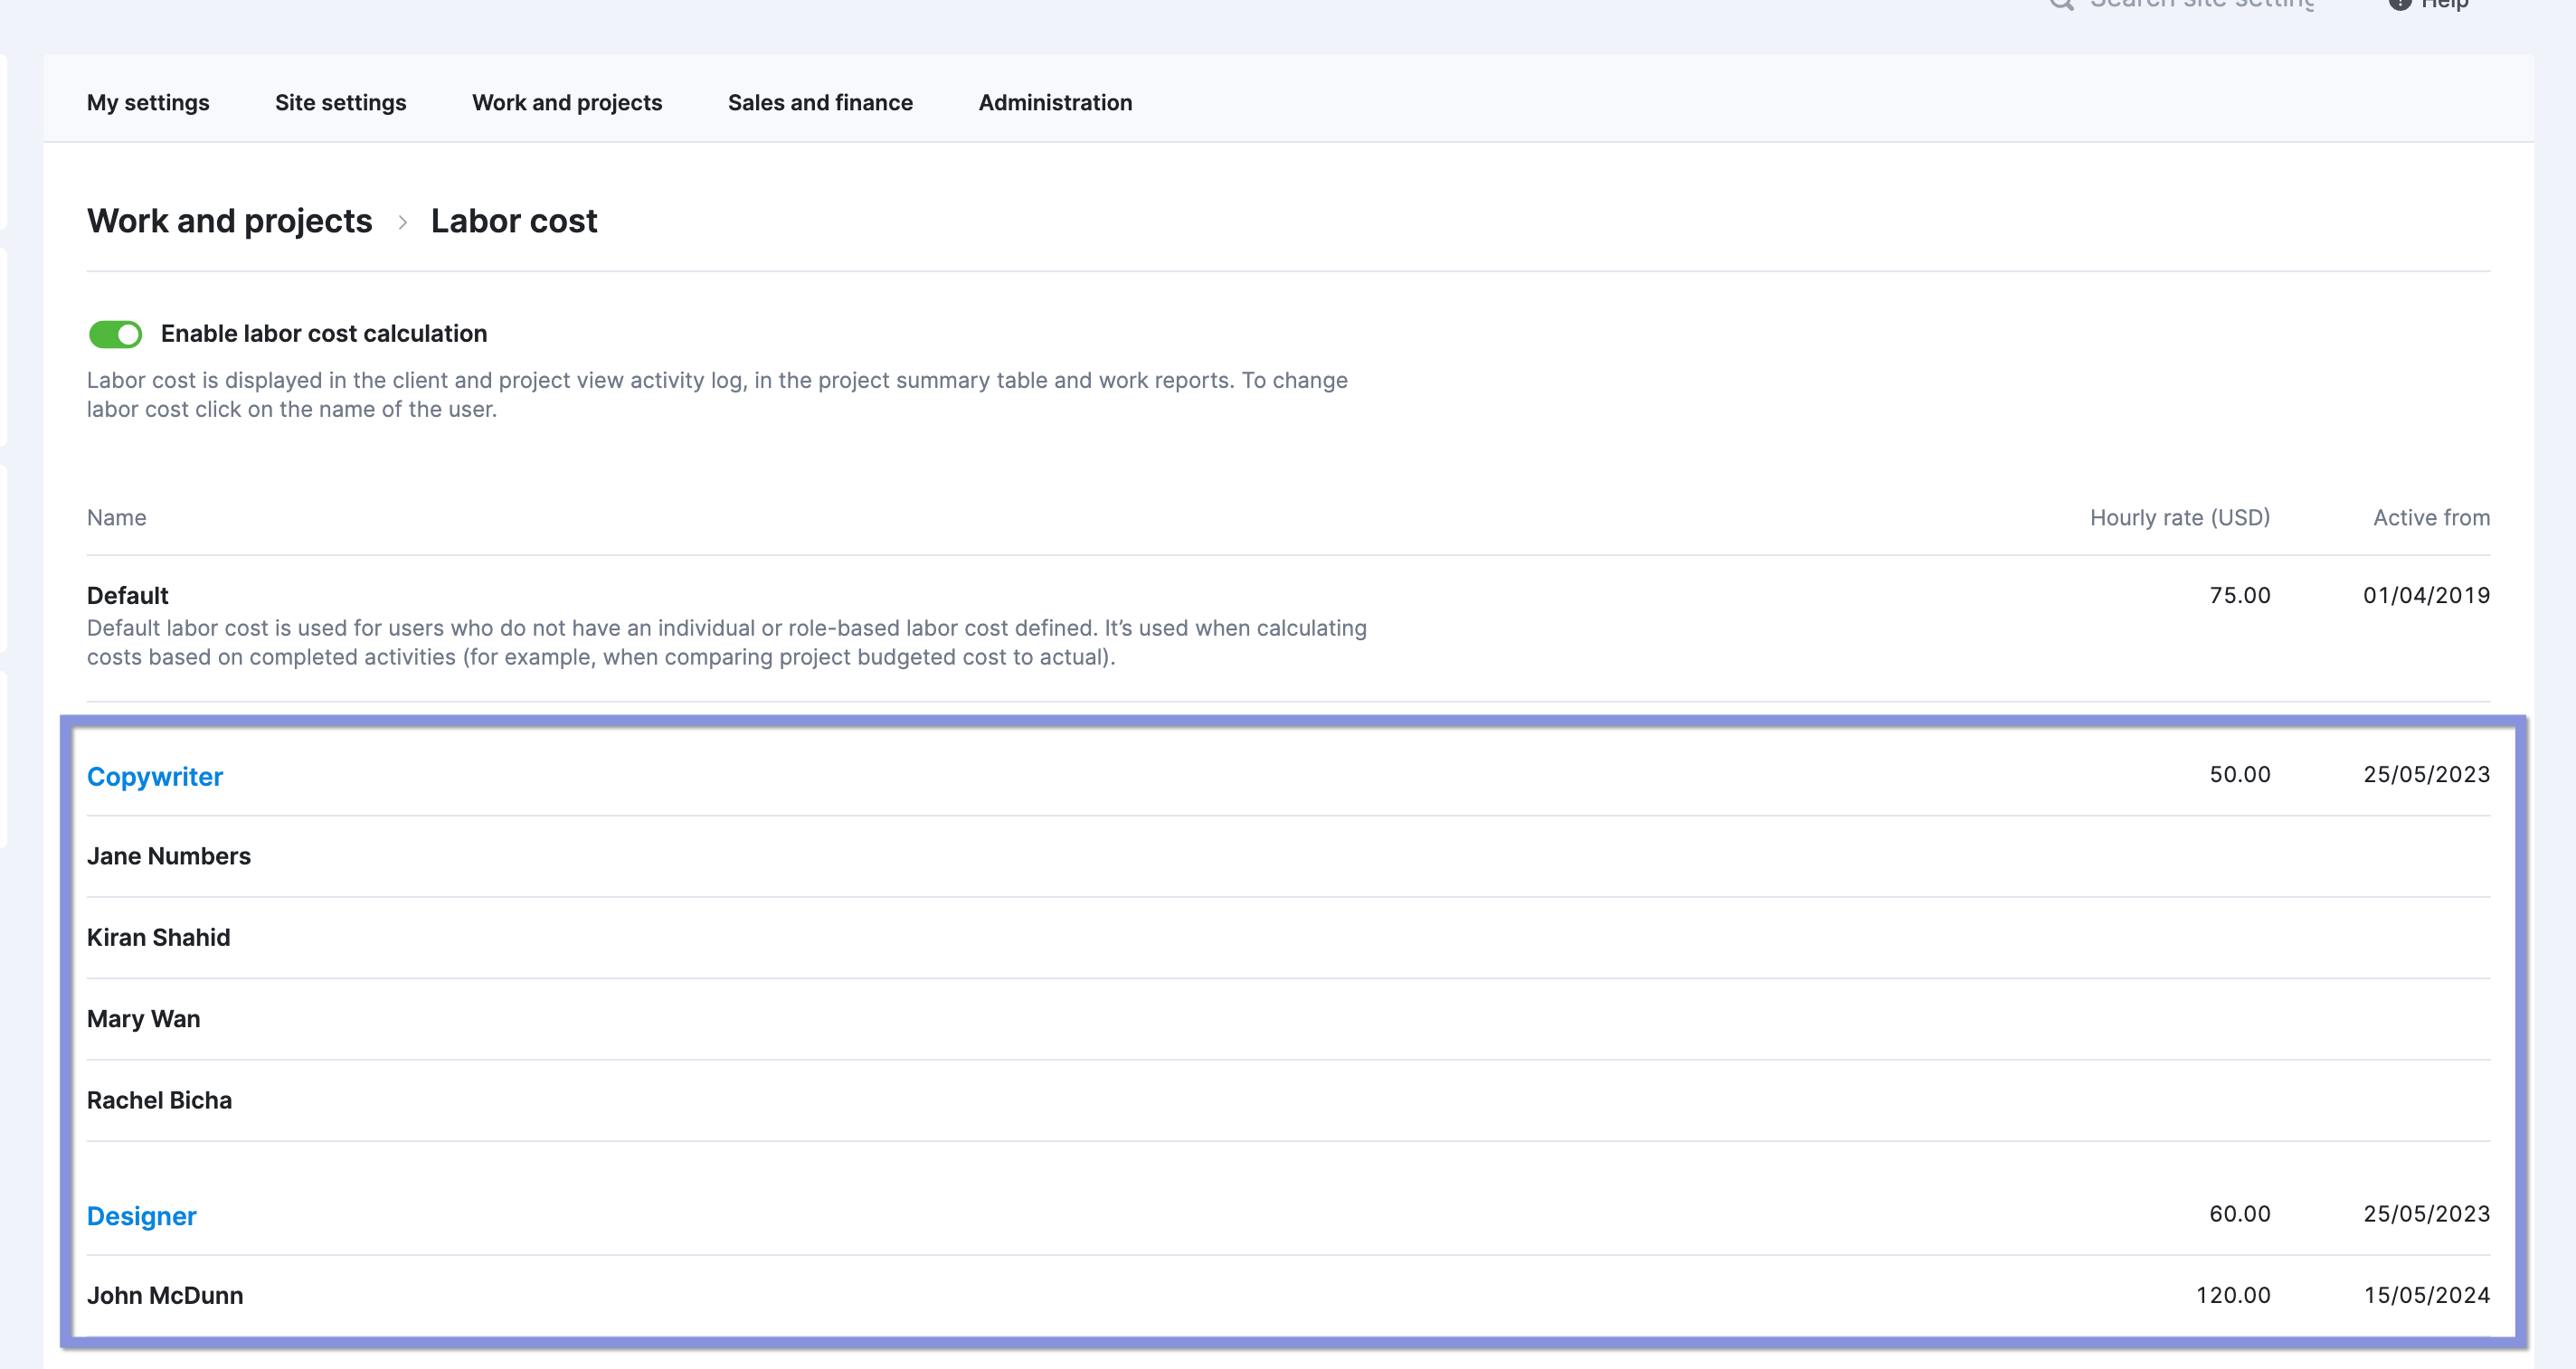
After you’ve saved them, Scoro automatically applies them in your quotes based on the hours you’ve entered and the specific team member or role you’ve chosen.
So you can instantly see the total cost of their work:
3. Use fixed-price contracts with vendors whenever possible
Fixed-price contracts let you anticipate costs down to the dollar. So you can avoid surprise expenses that derail your budget and spike your burn rate.
If you use hourly billing models with vendors, scope and timeline changes can cause costs to quickly skyrocket.
Why?
Because you have to pay for all time invested into the project, from extra vendor meetings to unplanned revision rounds. These small deviations eat into your budget and accelerate your burn rate.
Say you worked with a design agency that billed $125/hour with an estimated 100 hours of work. But after three rounds of additional (but necessary) revisions, those hours shot up to 140—pushing your costs $5,000 over budget.
So when discussing contracts with vendors, suggest a fixed-price one from the start. Emphasize how the vendors will also benefit from the arrangement. Unlike with hourly billing, they’ll know exactly how much they’ll make upfront. And don’t need to worry about tracking hours.
This approach also makes it easier to identify whether project changes fall outside the original scope of work.
To further set shared expectations and protect your budget, work with vendors to:
- Define their deliverables: “Deliver 10 web pages optimized for mobile and desktop”
- Set revision parameters: “Include two revision rounds per design, with additional revisions billed separately”
- Establish timelines: “Deliver the first draft in two weeks, with final delivery by the end of the month.”
- Plan communication protocols: “Weekly 30-minute check-in calls”
- Outline change request procedures: “Any work outside the initial scope shouldn’t be performed without an official agreement between both parties”
4. Have team members consistently track their time
Accurate burn rate monitoring relies on precise, real-time time tracking.
Delayed logging can create a misleading picture of project costs, making it harder to catch budget overruns early.
Take a mobile app development project, for example. By Friday, your burn rate appeared on track, with 45% of the budget used halfway through the timeline.
But on Monday, after developers logged untracked overtime, you discovered you were $3,600 over budget. Had time been recorded daily, you could have spotted the rising costs sooner and adjusted accordingly.
In Scoro, your team can track their time in three ways for accurate cost management:
- Real-time tracking with a timer
- Retrospective tracking with pre-populated timesheets
- Calendar tracking that automatically converts scheduled events into time entries
Take the task timer, for example. Team members just click it to start recording their time when they begin work. And there’s a pause button for breaks and the option to add progress notes.
These automated methods keep your burn rate calculations updated throughout the day and week.
Further reading: Billable Hours: A Guide for Professional Services Businesses
5. Put limits on external expenses
While labor costs often get the most attention, external expenses like software licenses, equipment, and travel can quietly drain your budget.
If not managed carefully, these costs can shrink profit margins and reduce flexibility for handling unexpected expenses.
Take a recent marketing project where your team scheduled frequent client site visits across multiple cities.
By month three, after reconciling all travel expenses, you discovered the visits had exceeded the budget by $7,500, cutting project profit margins in half.
As a result, your team introduced stricter travel policies—such as pre-approved budgets per client visit and prioritizing video calls over in-person meetings unless necessary.
You can keep expenses under control with Scoro’s approval flow feature.
This system lets you:
- Set value thresholds for purchases and trigger automatic approval notifications based on the value
- Review expense details before approving
- Request changes or modifications when needed
- Track approval statuses across all purchases
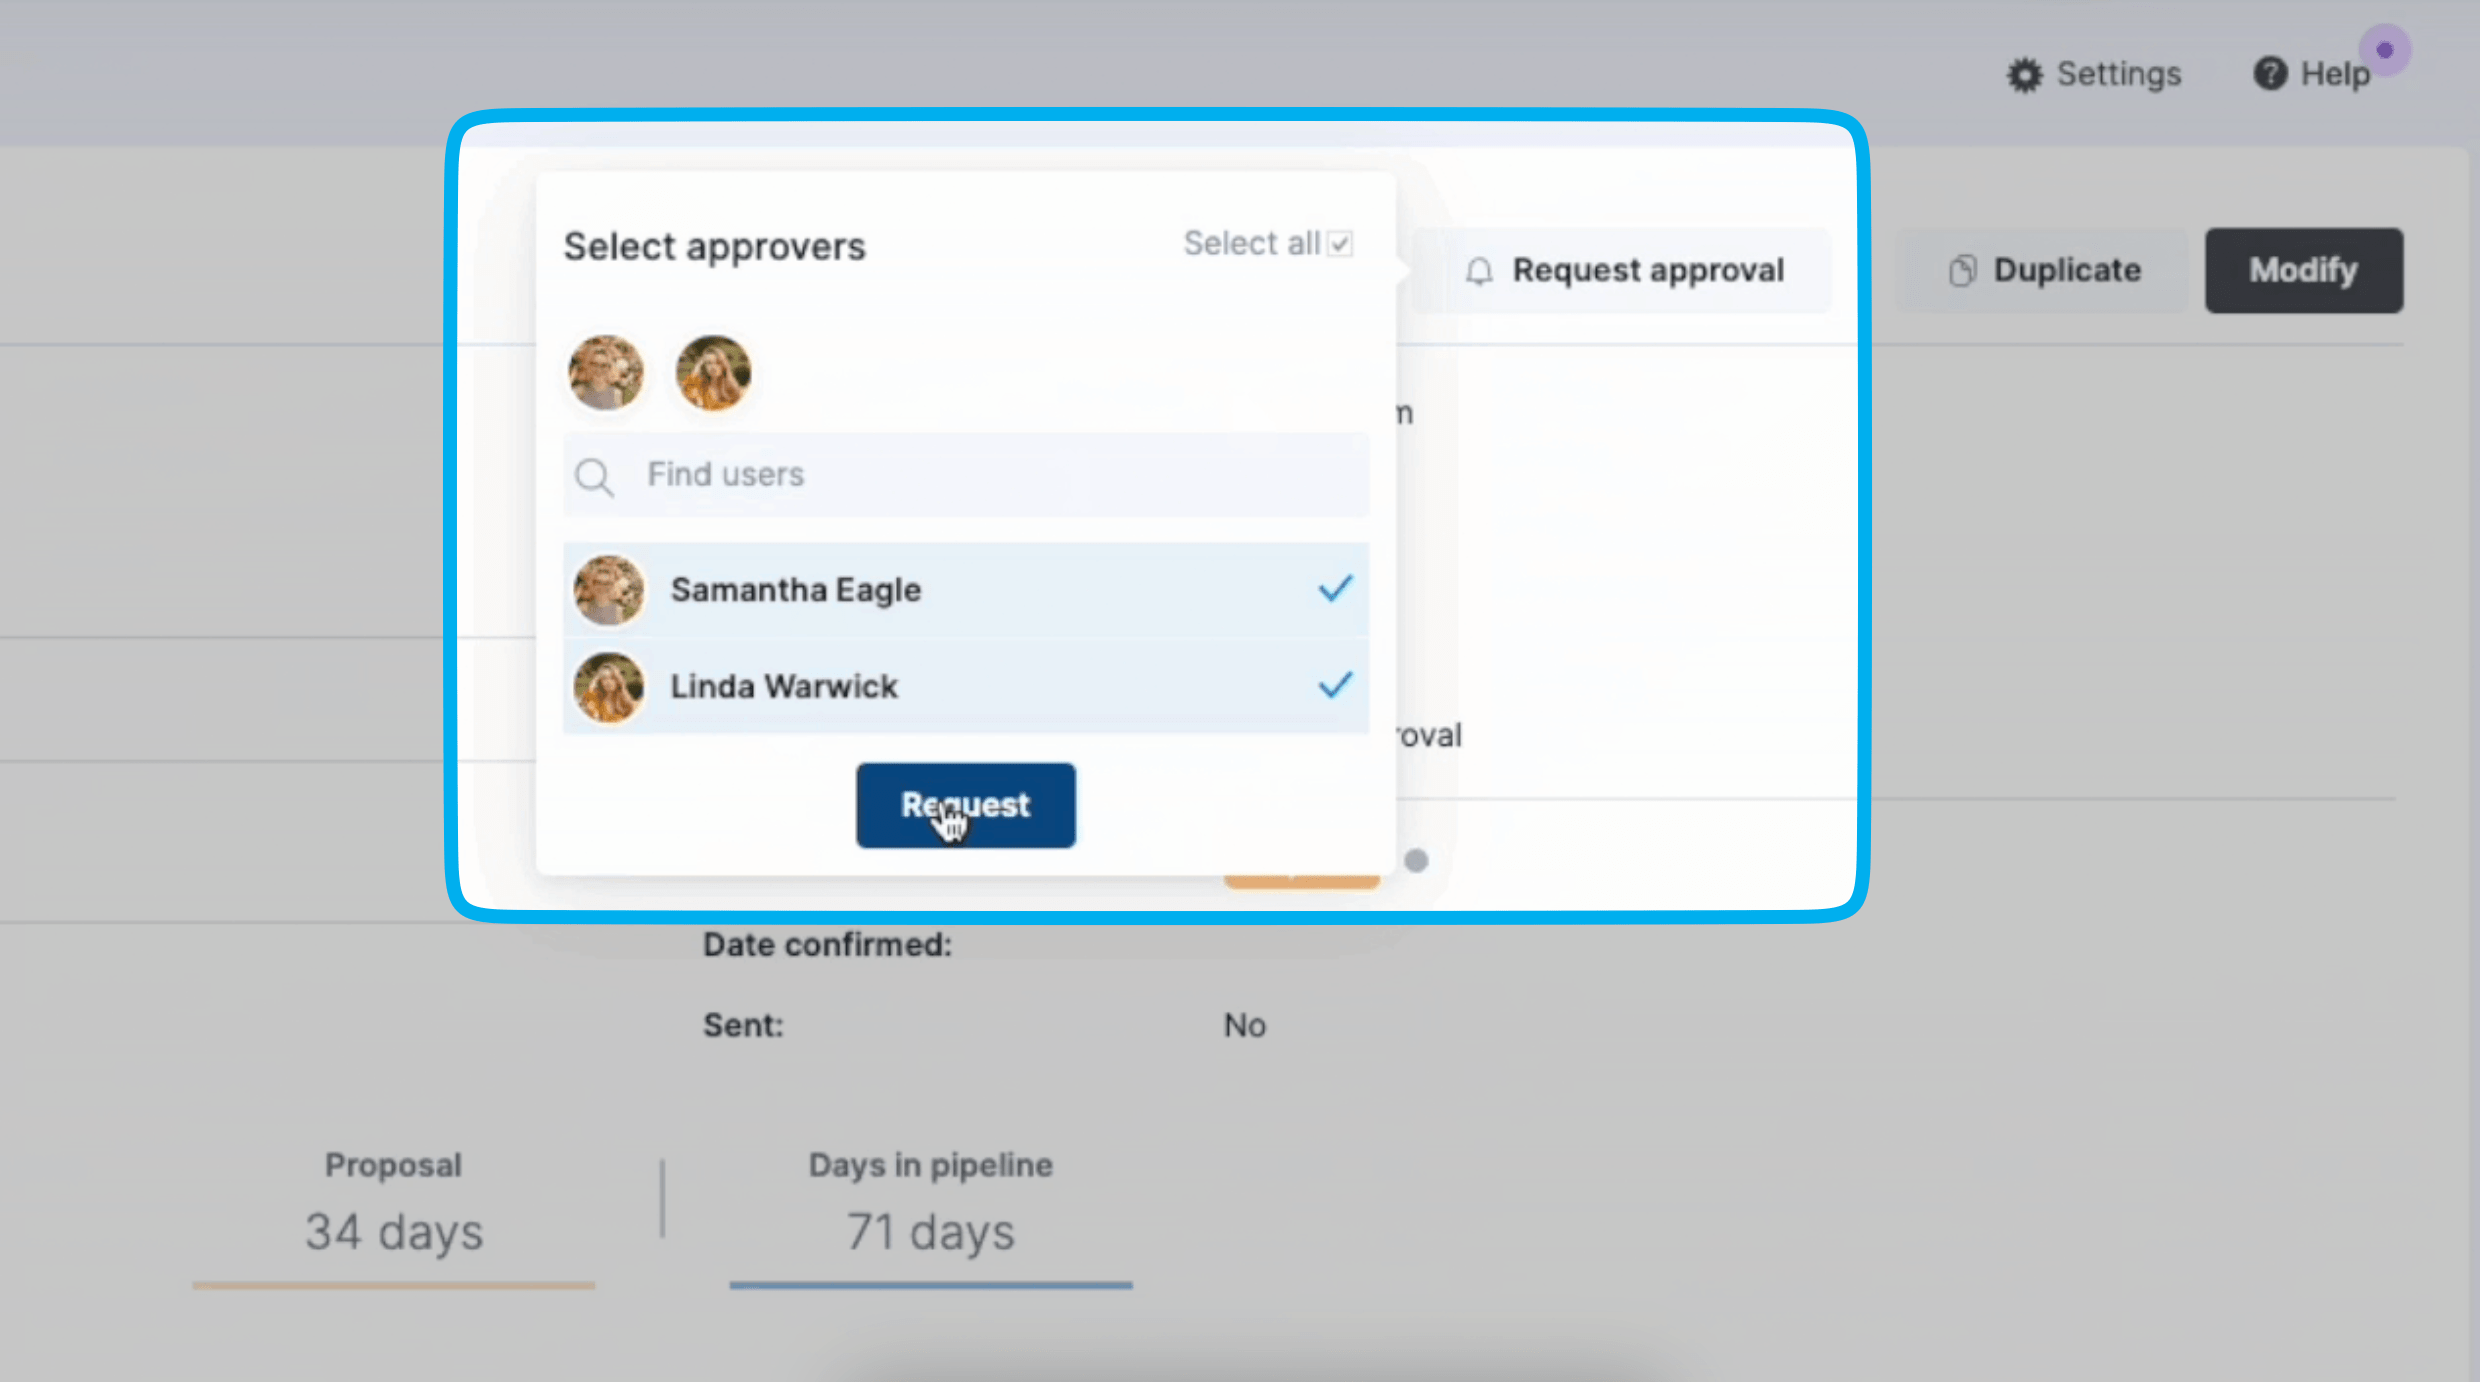
For example, you might set a $5,000 threshold for marketing expenses. So when a team member submits a $7,500 conference booth request, Scoro would instantly flag it for you before it goes through.
This automated workflow eliminates manual tracking and reduces the risk of excessive spending slipping through the cracks.
Top Tip
Connect Scoro to Expensify to create a single source of truth for expenses.
6. Learn from any budget overruns
Even with careful planning and budget tracking, budget overruns are sometimes unavoidable.
The key is to treat them as opportunities to improve your budget management for future projects.
Use Scoro to better understand where and why overspending occurred. And identify any patterns across different phases, tasks, deliverables, and clients.
Start with the “Project list” view, where you can see your entire portfolio.
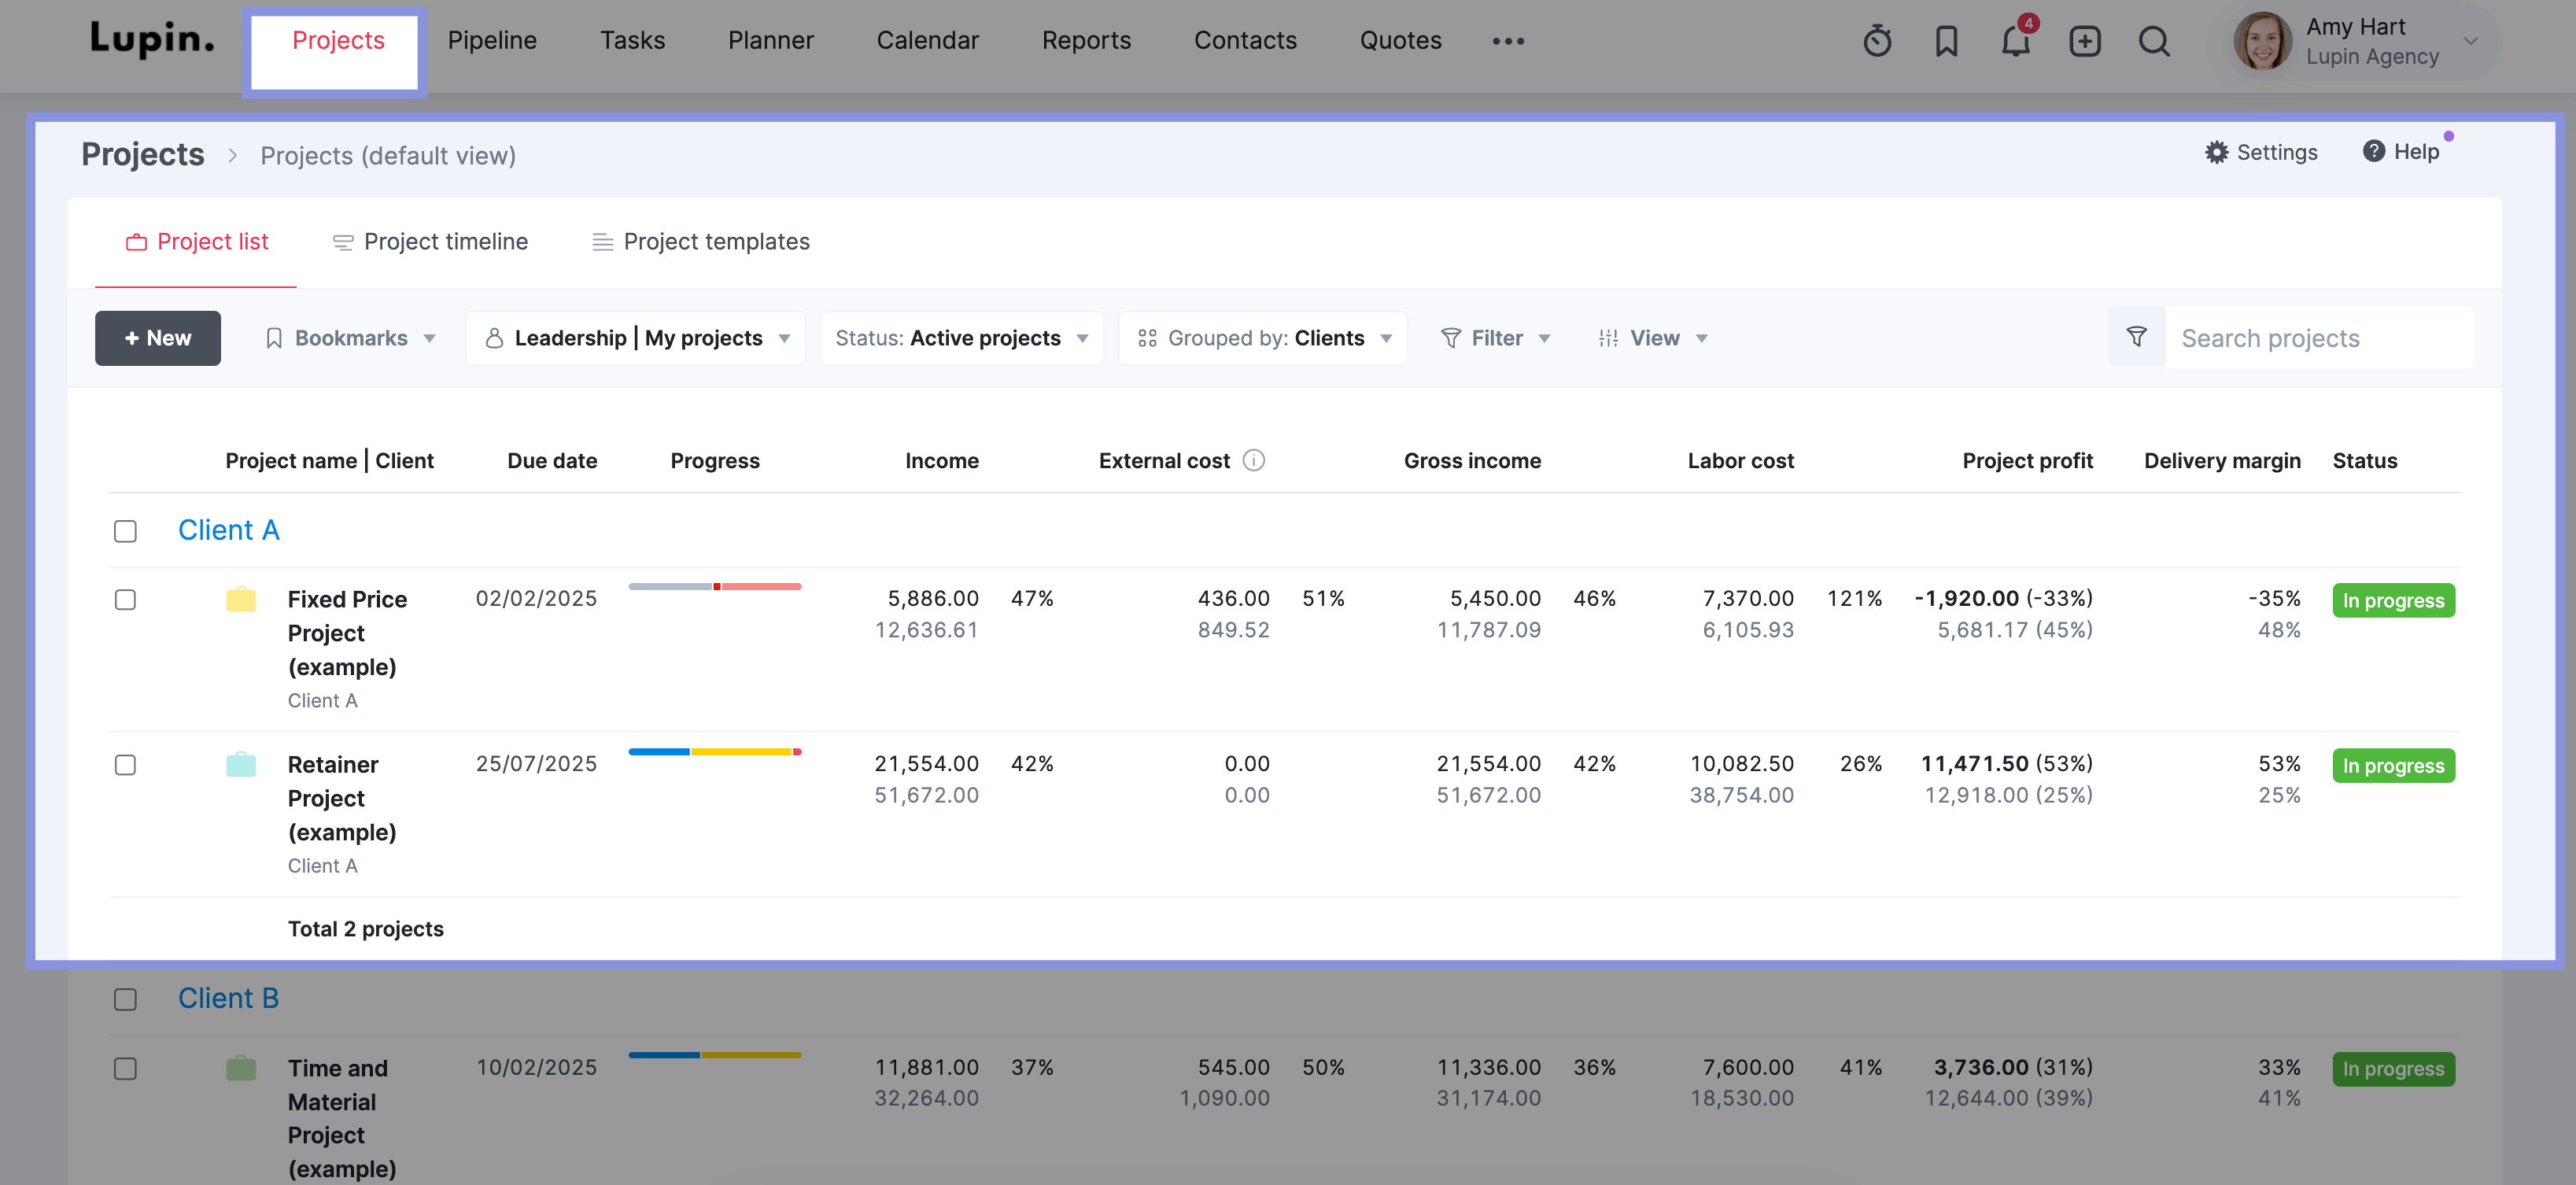
Use Scoro’s filter options to sort and show projects based on criteria like project type, start and end dates, countries, and more.
Then, click “View” > “Data Columns” to add key financial columns like income, project profit, labor cost, and expenses:

Use these financial columns to help you spot red flags—like projects with unusually high labor costs or low profit margins.
Focus on:
- Recording specific causes of accelerated burn rates
- Documenting successful mitigation strategies
- Updating project estimates based on actual data
- Building in reasonable buffers for high-risk areas
Say you found that content creation projects regularly showed higher-than-expected labor costs, with the past three projects taking between 30% to 50% longer than you planned.
So, moving forward, you know to expand that timeline for similar projects to prevent costly delays and keep your burn rate in check.
7. Track your planned vs. actual burn rate in real time
Compare your anticipated spending with your actual burn rate throughout the project.
This way, you give yourself time to course correct through small adjustments instead of having to scramble and make dramatic cuts toward the end.
Think of a six-month software development project with a $100,000 budget. You plan to spend around $16,500 per month.
But what if you only check spending at the three-month mark and discover you’ve blown through $20,000 each month?
If the pattern continues unchecked, you’ll end up $16,500 over budget—forcing you to scramble to adjust scope, cut features, or delay timelines just to stay afloat.
If you’d checked your project burn rate weekly, you could’ve gotten ahead of the overspending earlier on—well before you overspent by $3,300.
Use Scoro’s “Budget Health” graph to stay on top of your budget burn rate.
Its “Burn” chart shows your budget and live spending throughout the project:
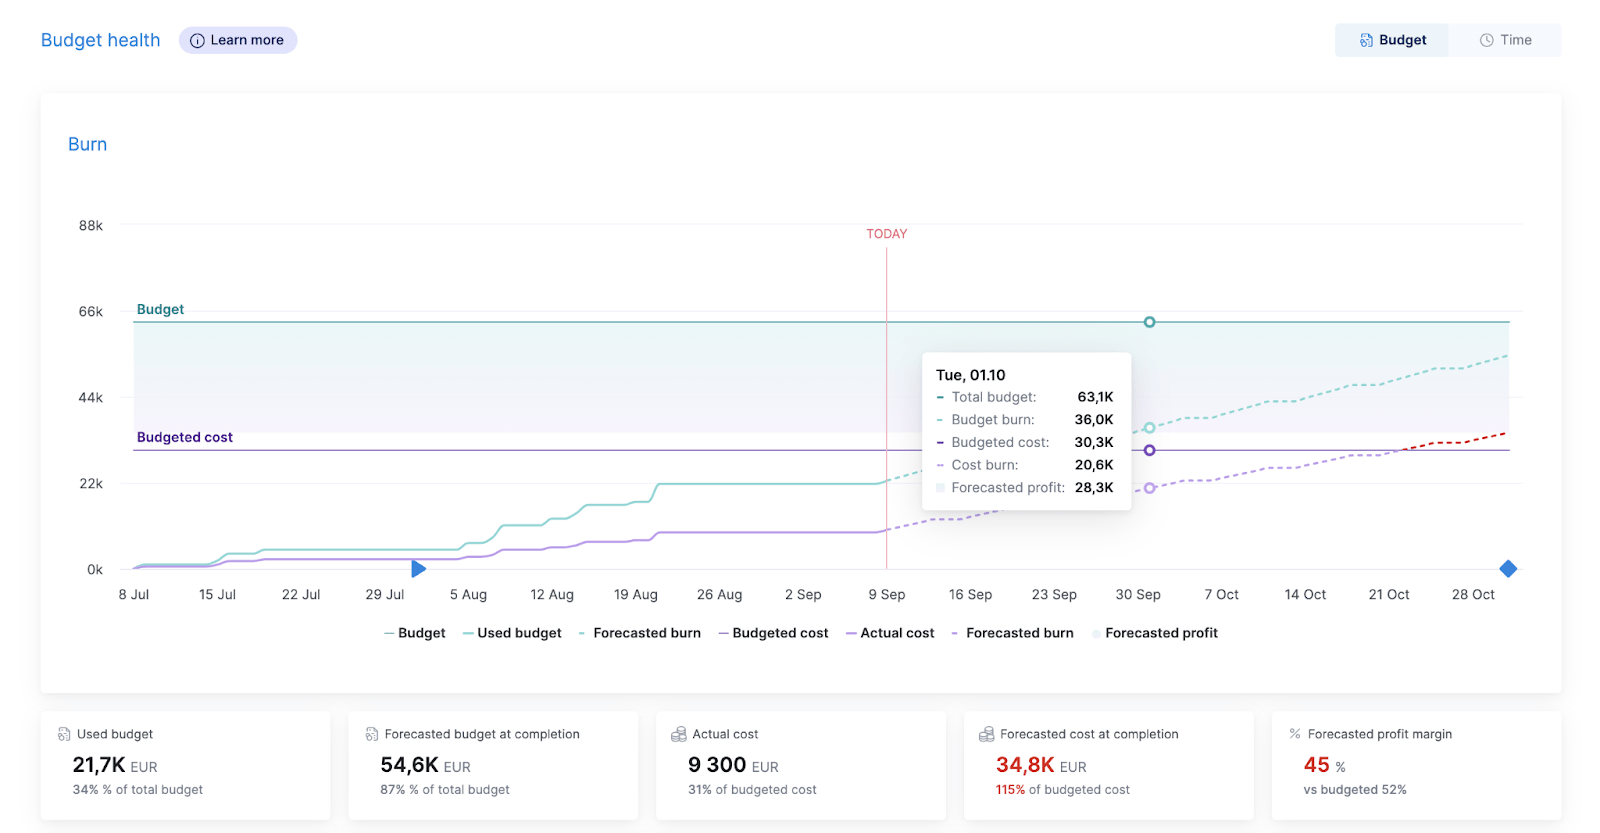
The chart maps four key metrics:
- Total approved budget to date (solid teal line)
- Projected approved budget for remaining timeline (dotted teal line)
- Actual internal costs spent to date (solid purple line)
- Projected internal costs for remaining timeline (dotted purple line)
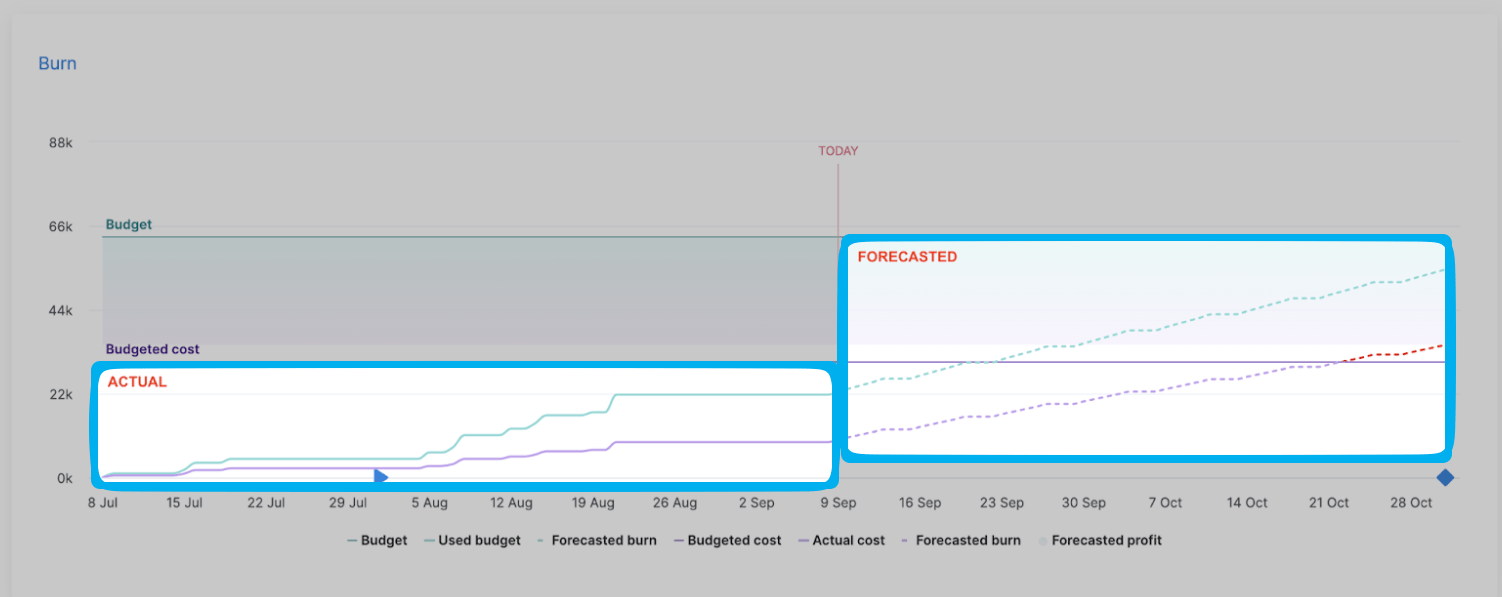
To calculate your burn rate, compare the purple line with the teal line at any given point.
If the teal line stays below or matches the budget line, your project is on track. If it rises above, you’re overspending—steeper slopes mean faster budget burn.
Say you’re reviewing burn rate weekly and notice by week two that you’ve spent $8,000 of a $60,000 budget. Using our burn rate formula (spend/budget), that’s $8,000/$60,000 = 13% of your budget burned through when you’ve only completed 4% of your timeline. Since you’re burning budget more than three times as fast as planned, you can take immediate action.
This early awareness lets you pause non-essential work, optimize resource assignments, or adjust timelines while you still have 96% of your project duration to course-correct.
Take control of your project burn rate
Manually monitoring project spending creates blind spots in your financial oversight.
Creative agency WC+A learned this firsthand. Before implementing Scoro, they relied on manual spreadsheets that were often days or weeks out of date, making it impossible to catch overspending until it had ruined their margins.
By switching to Scoro, they can quickly notice concerning spending trends, adjust course, and use these insights to create more accurate estimates for future projects. All of which has led to stronger profit margins.
Try Scoro for free today to gain instant budget oversight and deliver more profitable work.