

Ever take on high-revenue projects and get surprised by low (or even negative) profits at the end? Talk about frustrating.
In this guide, we’ll explain project return on investment (ROI), and you’ll discover a more accurate way to measure project profitability than simple ROI calculations.
What is project ROI?
Project ROI measures a project’s true profitability by comparing its revenue to its cost to deliver.
It answers the question: “For every dollar we invested, how much did we earn back?”
You calculate project ROI using this formula:
(Project Revenue – Project Costs) / Project Costs x 100 = Project ROI %
See how it factors in both revenue and costs?
If you just look at revenue, you’re not factoring in how much you actually have to spend to earn that revenue, which can lead to taking on projects that hurt your bottom line with a low or negative ROI instead of helping it.
What project costs should you consider?
Project costs include all expenses directly associated with the project. These can be categorized as:
Direct Costs:
- Labor Costs: Salaries, wages, benefits, and any payroll taxes associated with the project team members directly involved in project execution.
External Costs:
- Supplier Bills/Invoices: Payments to external vendors or contractors for services or goods provided specifically for the project.
- Project Expenses: Out-of-pocket expenses incurred by the project team, including items such as Equipment rentals or purchases, travel costs (flights, accommodation, meals, transportation), software or subscription fees
Types of project ROI
There are four main types of project ROI:
- Anticipated/Expected ROI: The ROI you predict based on estimated revenue and costs during project planning.
- Actual ROI: The real ROI is calculated using the final revenue and cost numbers after completing the project.
- Positive ROI: A positive project ROI is the ultimate goal for any project. It signifies that the project generated more revenue than it cost, resulting in a net profit.
- Negative ROI: A negative project ROI indicates that a project’s costs exceeded its revenue, resulting in a financial loss.
Positive ROI Example
A marketing agency just completed a $200,000 website redesign project.
Here’s how the project financials break down:
- Revenue: $200,000
- Costs: $125,000 (labor, software licenses, stock imagery, etc.)
Now, let’s plug those numbers into the ROI formula:
($200,000 – $125,000) / $125,000 x 100 = 60%
The 60% ROI represents the return on investment for this project. This means that the agency earned an additional 60 cents in profit for every dollar invested in the project.
Negative ROI Example
A consulting agency just finished a $100,000 strategy project.
Here’s what the organization made—and what they spent:
- Revenue: $100,000
- Costs: $130,000 (labor, software licenses, stock imagery, etc.)
Now, let’s run the ROI calculation:
($100,000 – $130,000) / $130,000 x 100 = -23.08%
A -23% ROI means the agency lost almost a quarter of its investment in the project.
A cost breakdown can reveal areas for improvement to ensure future projects deliver a positive ROI. Analyzing consultant rates, exploring alternative research methods, or refining project scoping processes could be part of this analysis.
The benefits of calculating project ROI
Knowing your project ROI helps you:
Determine which projects and clients to take on (or avoid)
High ROI projects with low-maintenance clients are ideal. Project ROI analysis helps you identify these projects and their associated clients. This allows you to prioritize attracting clients who bring profitable projects and avoid those that drain resources without a strong return.
Improve your pricing
Low prices can lead to projects costing more than they bring in, resulting in financial losses. However, charging too high can cause you to lose work to competitors with lower rates.
So, what do you do?
Look at the ROI on past projects. This will help you find the pricing sweet spot that maintains both your profit margins and competitive edge.
For example, analyzing project ROI data might reveal that projects with X type of deliverable consistently yield a higher ROI, leading you to adjust your pricing model to prioritize those high-value services.
Optimize your spending
Project ROI analysis helps you identify which parts of your project are the most profitable and which are not. By analyzing your project data, you can pinpoint the tasks or activities that consistently lead to higher profits. These areas are where investing more resources will likely yield the greatest ROI.
Delivery margin: a deeper dive into project profitability
While project ROI gives you a broad overview of a project’s financial success, delivery margin, on the other hand, focuses on the profitability of your team’s work.
It measures the profit generated from your labor after covering your direct costs (like salaries and software), excluding any costs passed through to the client (like subcontractor fees).
The formula is:
(Gross Revenue – Delivery Costs) / Gross Revenue x 100 = Delivery Margin %
Project ROI vs delivery margin: which is more important?
Both Project ROI and delivery margin offer valuable insights, but their focus differs:
- Project ROI is a broader measure of overall project success, reflecting the project’s profitability as a whole.
- Delivery Margin zooms in on your team’s efficiency, revealing how much profit you generate from your core services.
Delivery margin is often a more critical metric for agencies and consultancies. It directly reflects your team’s productivity, utilization, and profitability.
Imagine two projects at a design agency:
Project A (Website Design):
- Revenue: $20,000
- Direct Costs: $10,000 (labor, software, etc.)
- External Costs: $5,000 (subcontracted photography)
- Project ROI: 50% ((20,000 – 15,000) / 15,000 * 100)
- Delivery Margin: 50% ((20,000 – 10,000) / 20,000 * 100)
Project B (Logo Design):
- Revenue: $10,000
- Direct Costs: $2,000 (labor, software, etc.)
- External Costs: $0
- Project ROI: 400% ((10,000 – 2,000) / 2,000 * 100)
- Delivery Margin: 80% ((10,000 – 2,000) / 10,000 * 100)
At first glance, Project B seems much more profitable due to its higher ROI. However, the agency’s core competency is design work, not subcontracting photography. Therefore, the delivery margin is a more accurate reflection of their profitability.
- Project A: While it has a lower ROI, its 50% delivery margin shows that the agency is efficiently using its team’s skills to profit from its core design services.
- Project B: The 400% ROI is impressive, but it’s inflated by the lack of external costs. The 80% delivery margin is a better indicator of the profitability of the agency’s actual design work.
4 best practices for measuring and monitoring project profitability
Accurate and timely data is the foundation of effective project profitability analysis.
Avoid costly mistakes and ensure your calculations are precise with these four best practices:
1. Rely on historical data to inform your expected delivery margin
Ballpark estimates are fine for initial client chats. But you shouldn’t use them to predict your project profit.
Why?
This guesswork can lead to figures far from reality, especially for complex projects with big teams and multiple deliverables.
The solution? Base cost estimates on concrete historical data instead of ballpark numbers.
Scoro makes this easy.
Go to the “Reports” module and click the “Profitability” box.
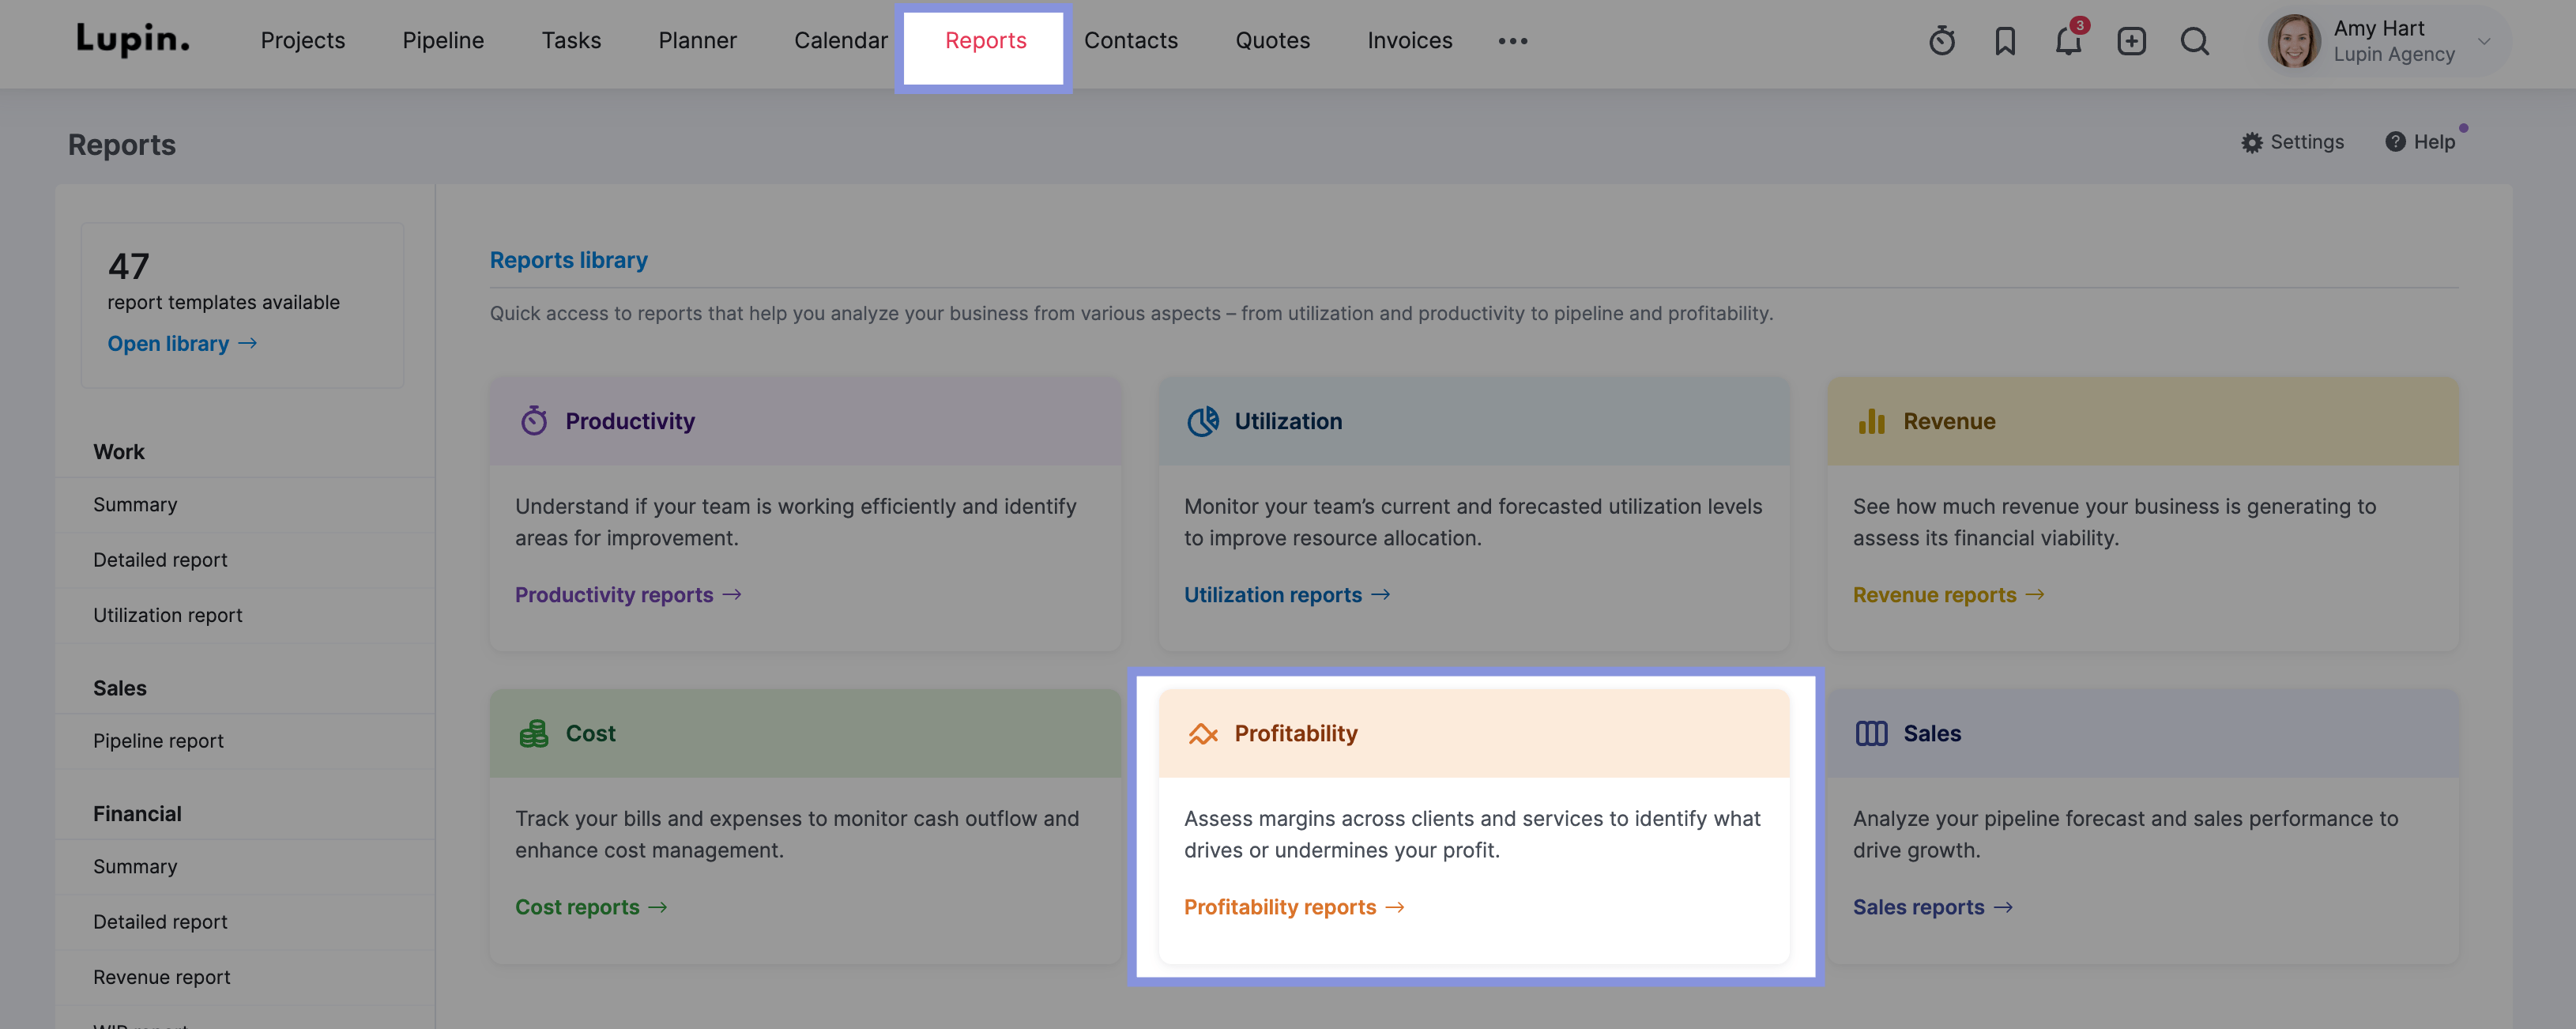
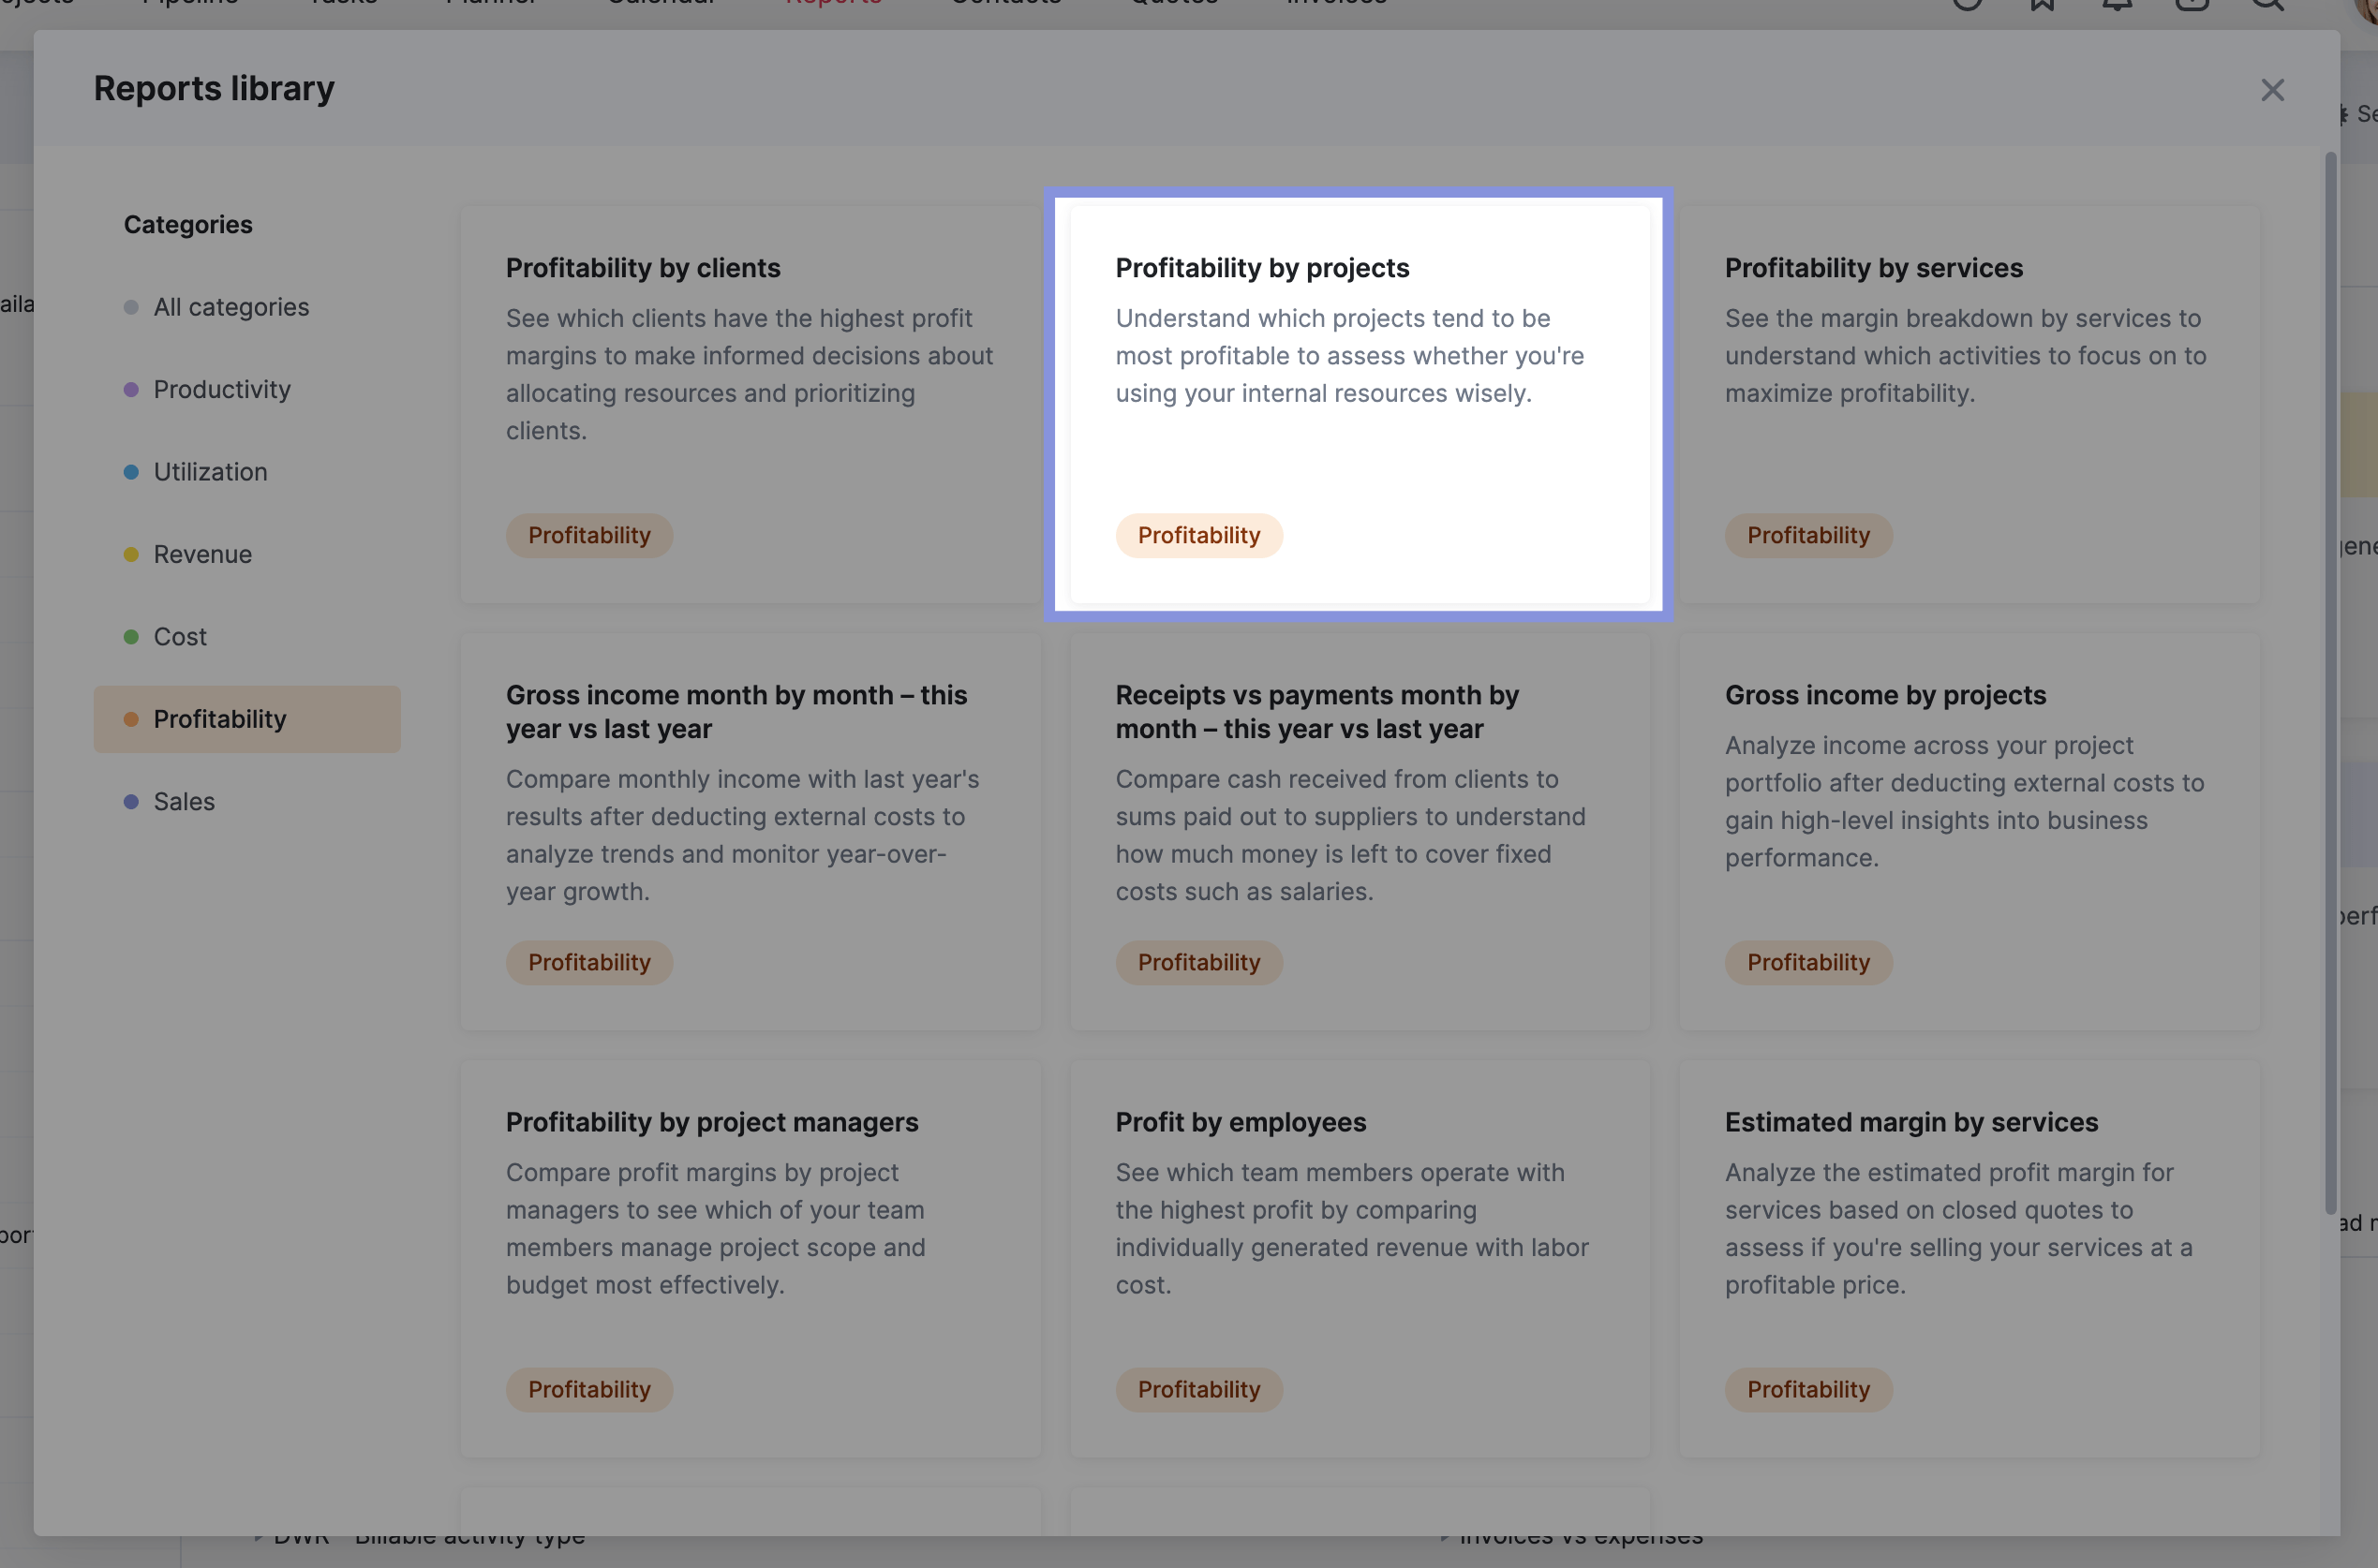
Then, click on “Profitability by projects.”
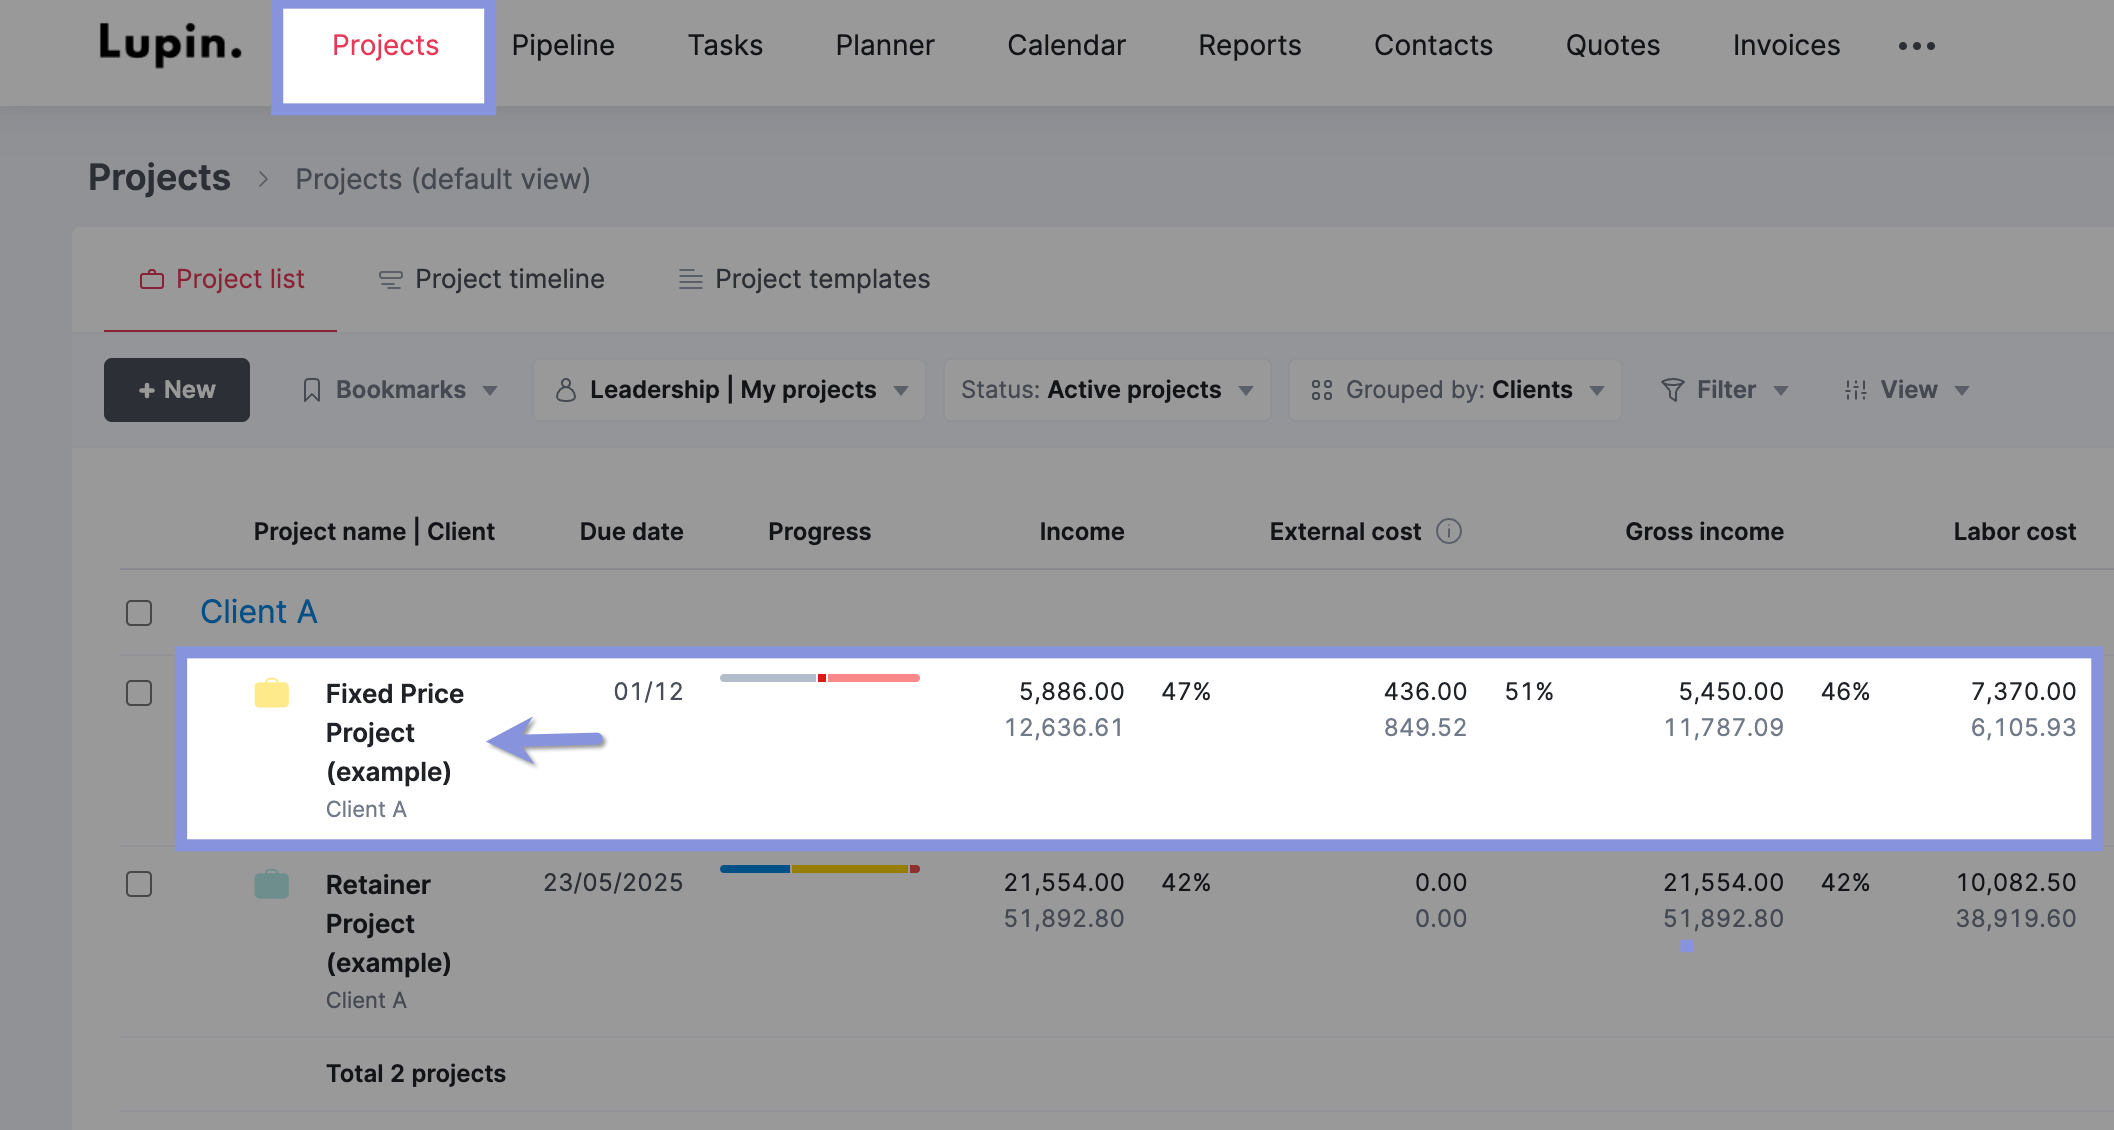
This will take you to the “Project” list view. Click “View” > “Data columns,” check “Delivery margin,” and then hit “Display”

Now, you’ll have a clear breakdown of key profitability metrics for each project, including:
- Income: The actual revenue generated by the project.
- External Cost: Costs for external vendors or suppliers.
- Labor Cost: The cost of your team’s time on the project.
- Project Profit: The project’s overall profit, accounting for all costs.
- Delivery Margin: The profit your team generates after covering their direct costs.
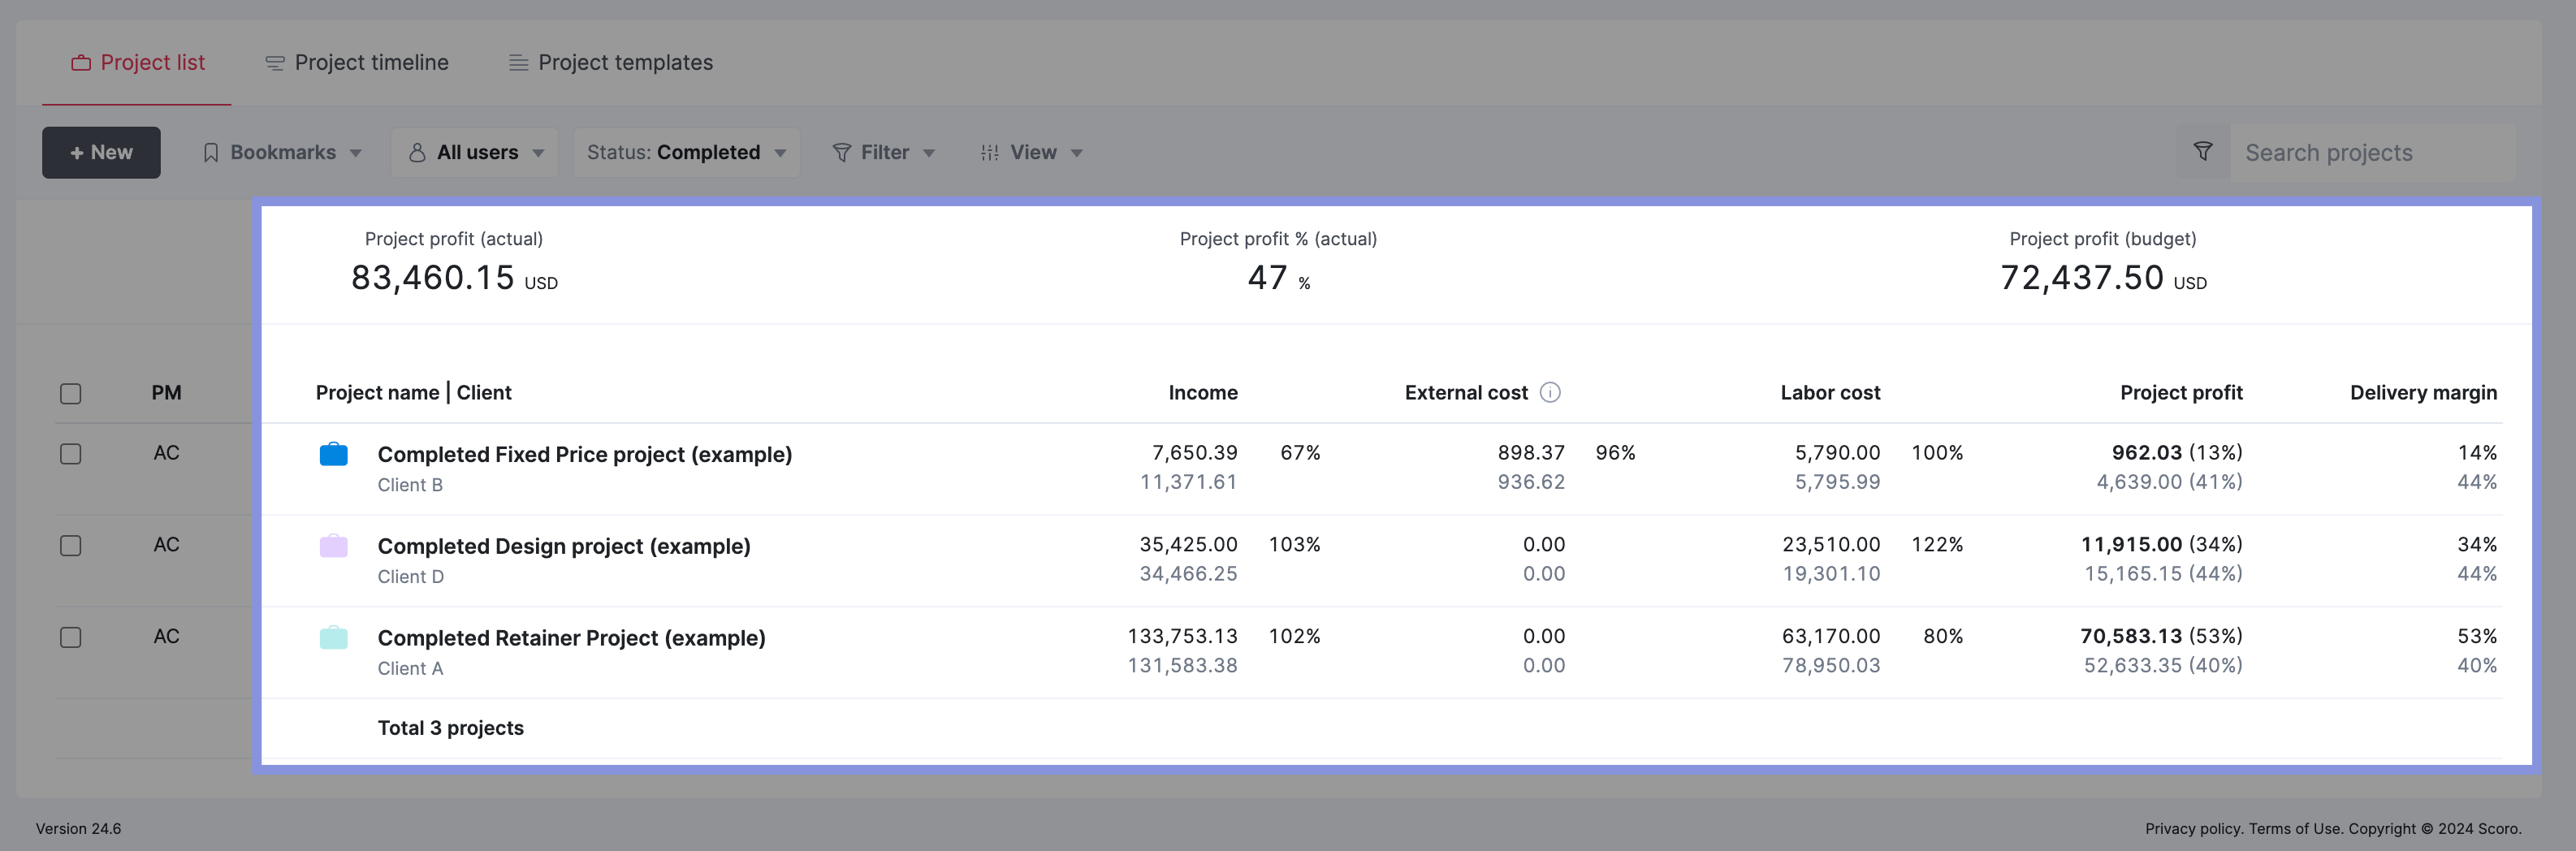
Each project’s actual results are displayed in bold, while the planned numbers are in gray.
2. Automate your profit calculations
Skip the manual profitability math to save yourself time. And save your projects from potential financial losses.
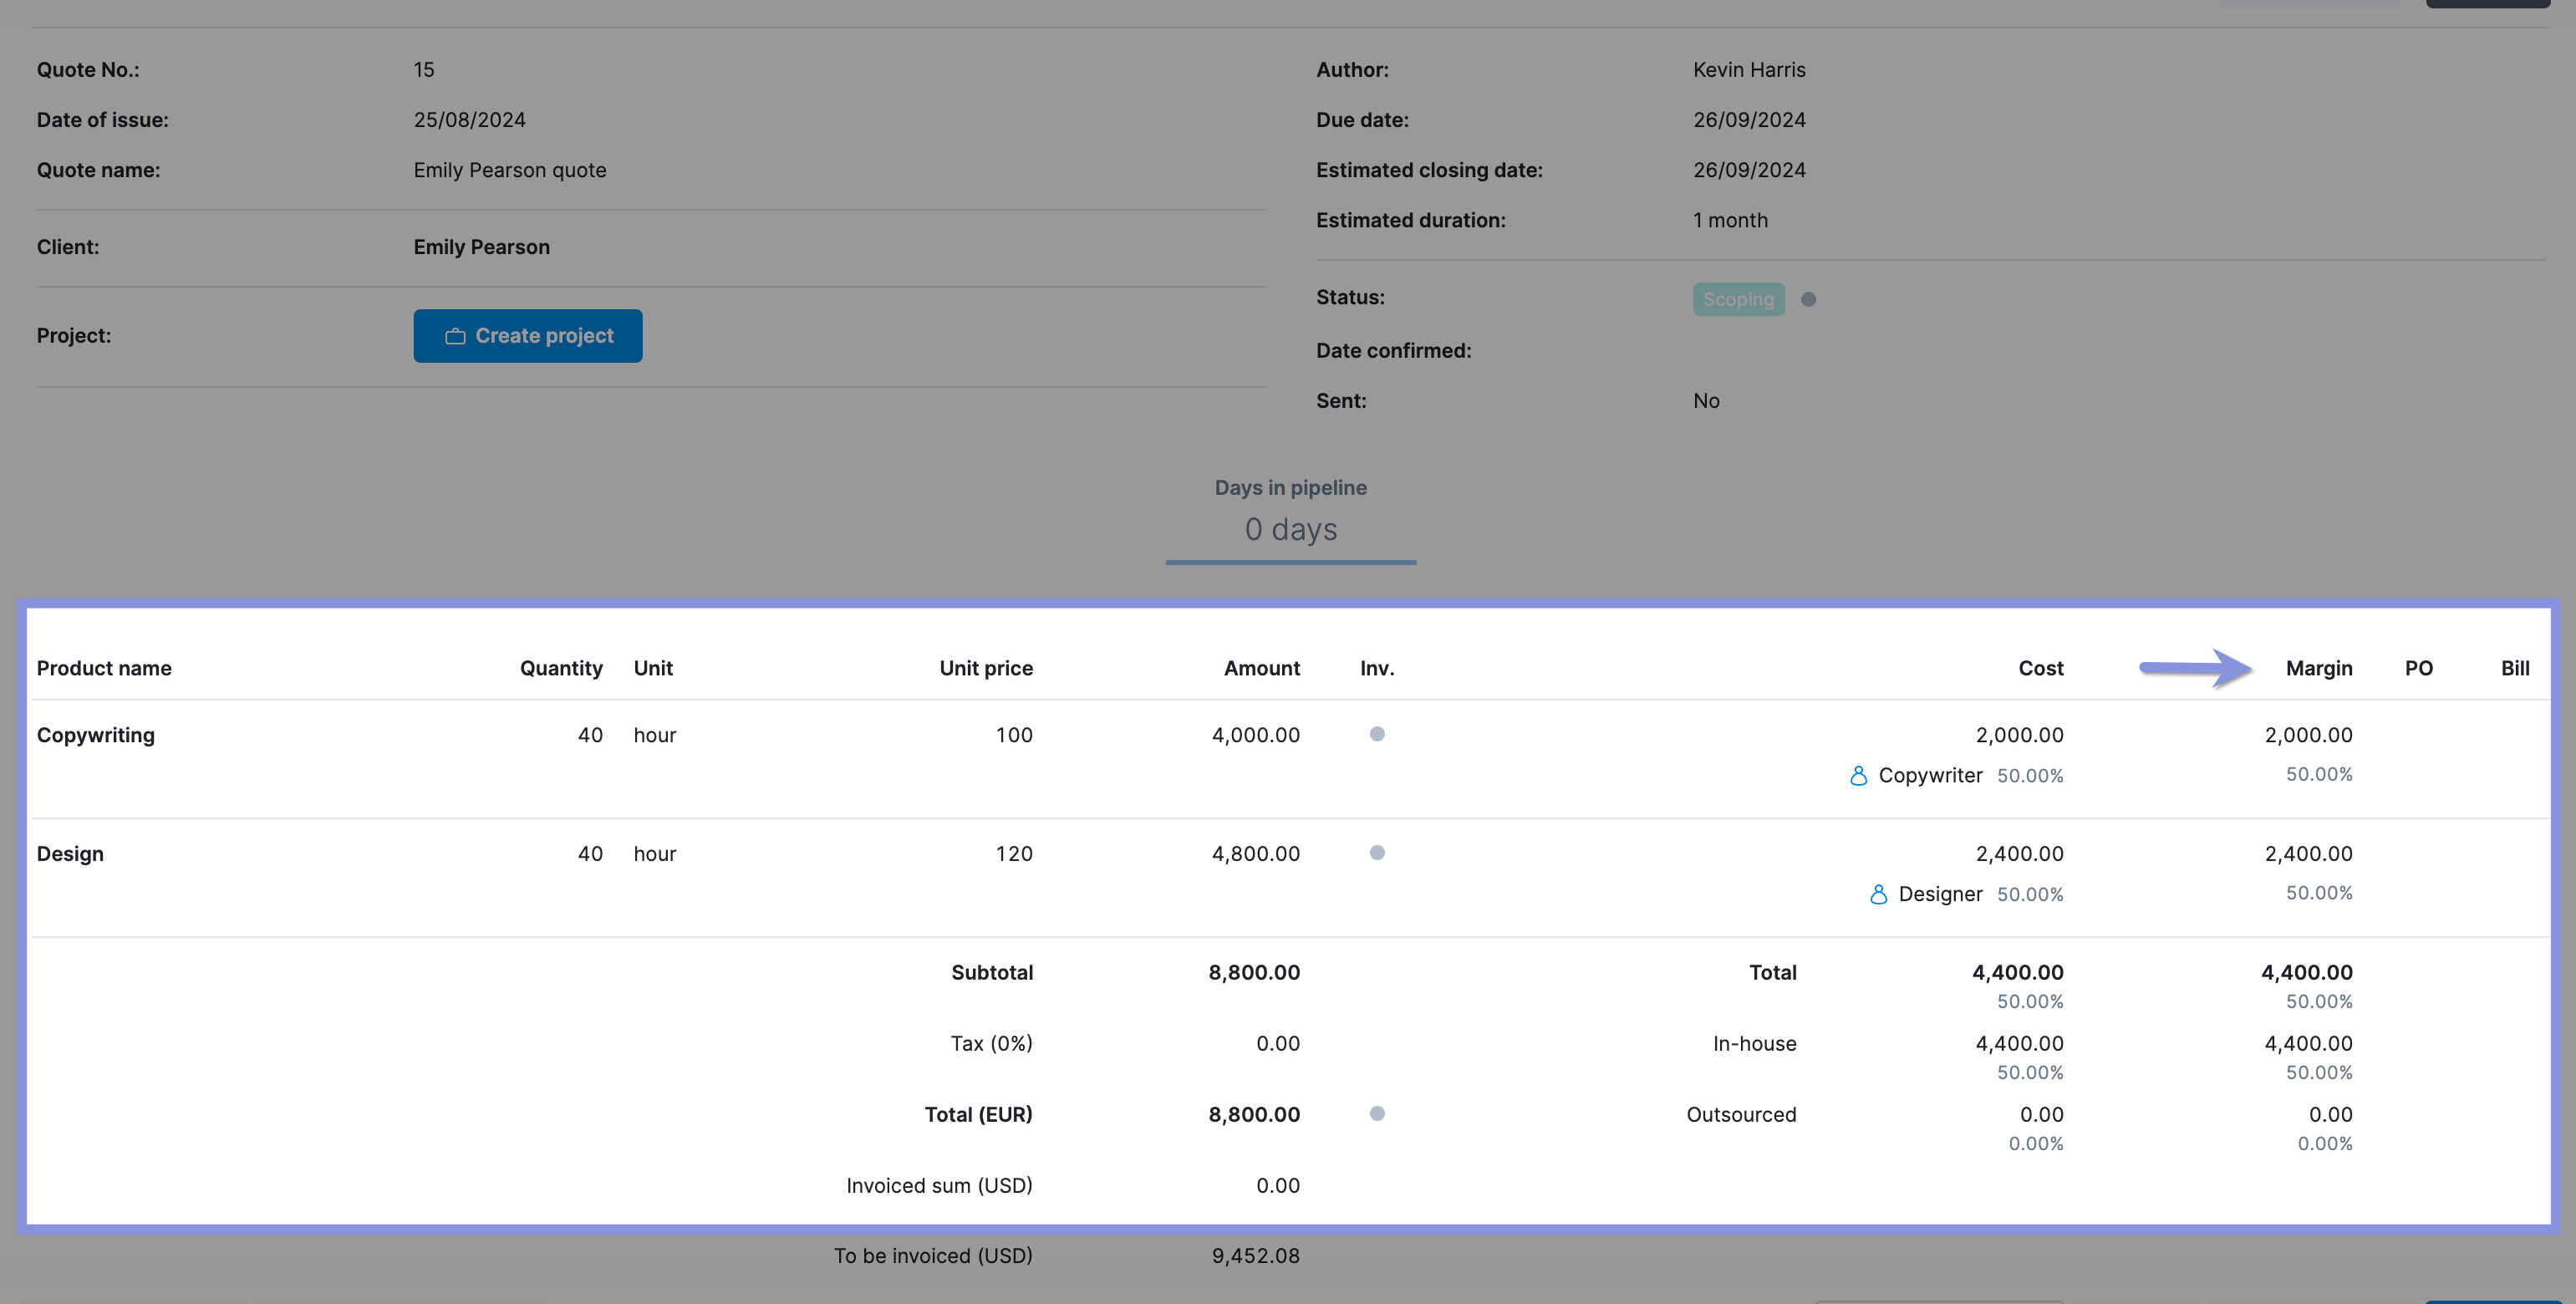
Scoro automatically calculates your project profitability before, during, and after your projects are finished.
View your expected delivery margin, “Margin” column for each quote you build at the bottom.
This will help you decide whether it’s smart to take on a project, pass on it, or adjust pricing to make it worth your team’s time.
Further Reading: Project Cost Estimation: A Guide to Quoting Profitable Projects
3. Keep an eye on your budget health
Managing your project’s budget is crucial.
If you don’t, it’s easy to miss problems that can hurt your profit, like the project growing bigger than planned or tasks taking way longer than expected.
You can easily track all project-related costs in Scoro. Click on the “Projects” module, then click on any individual project.
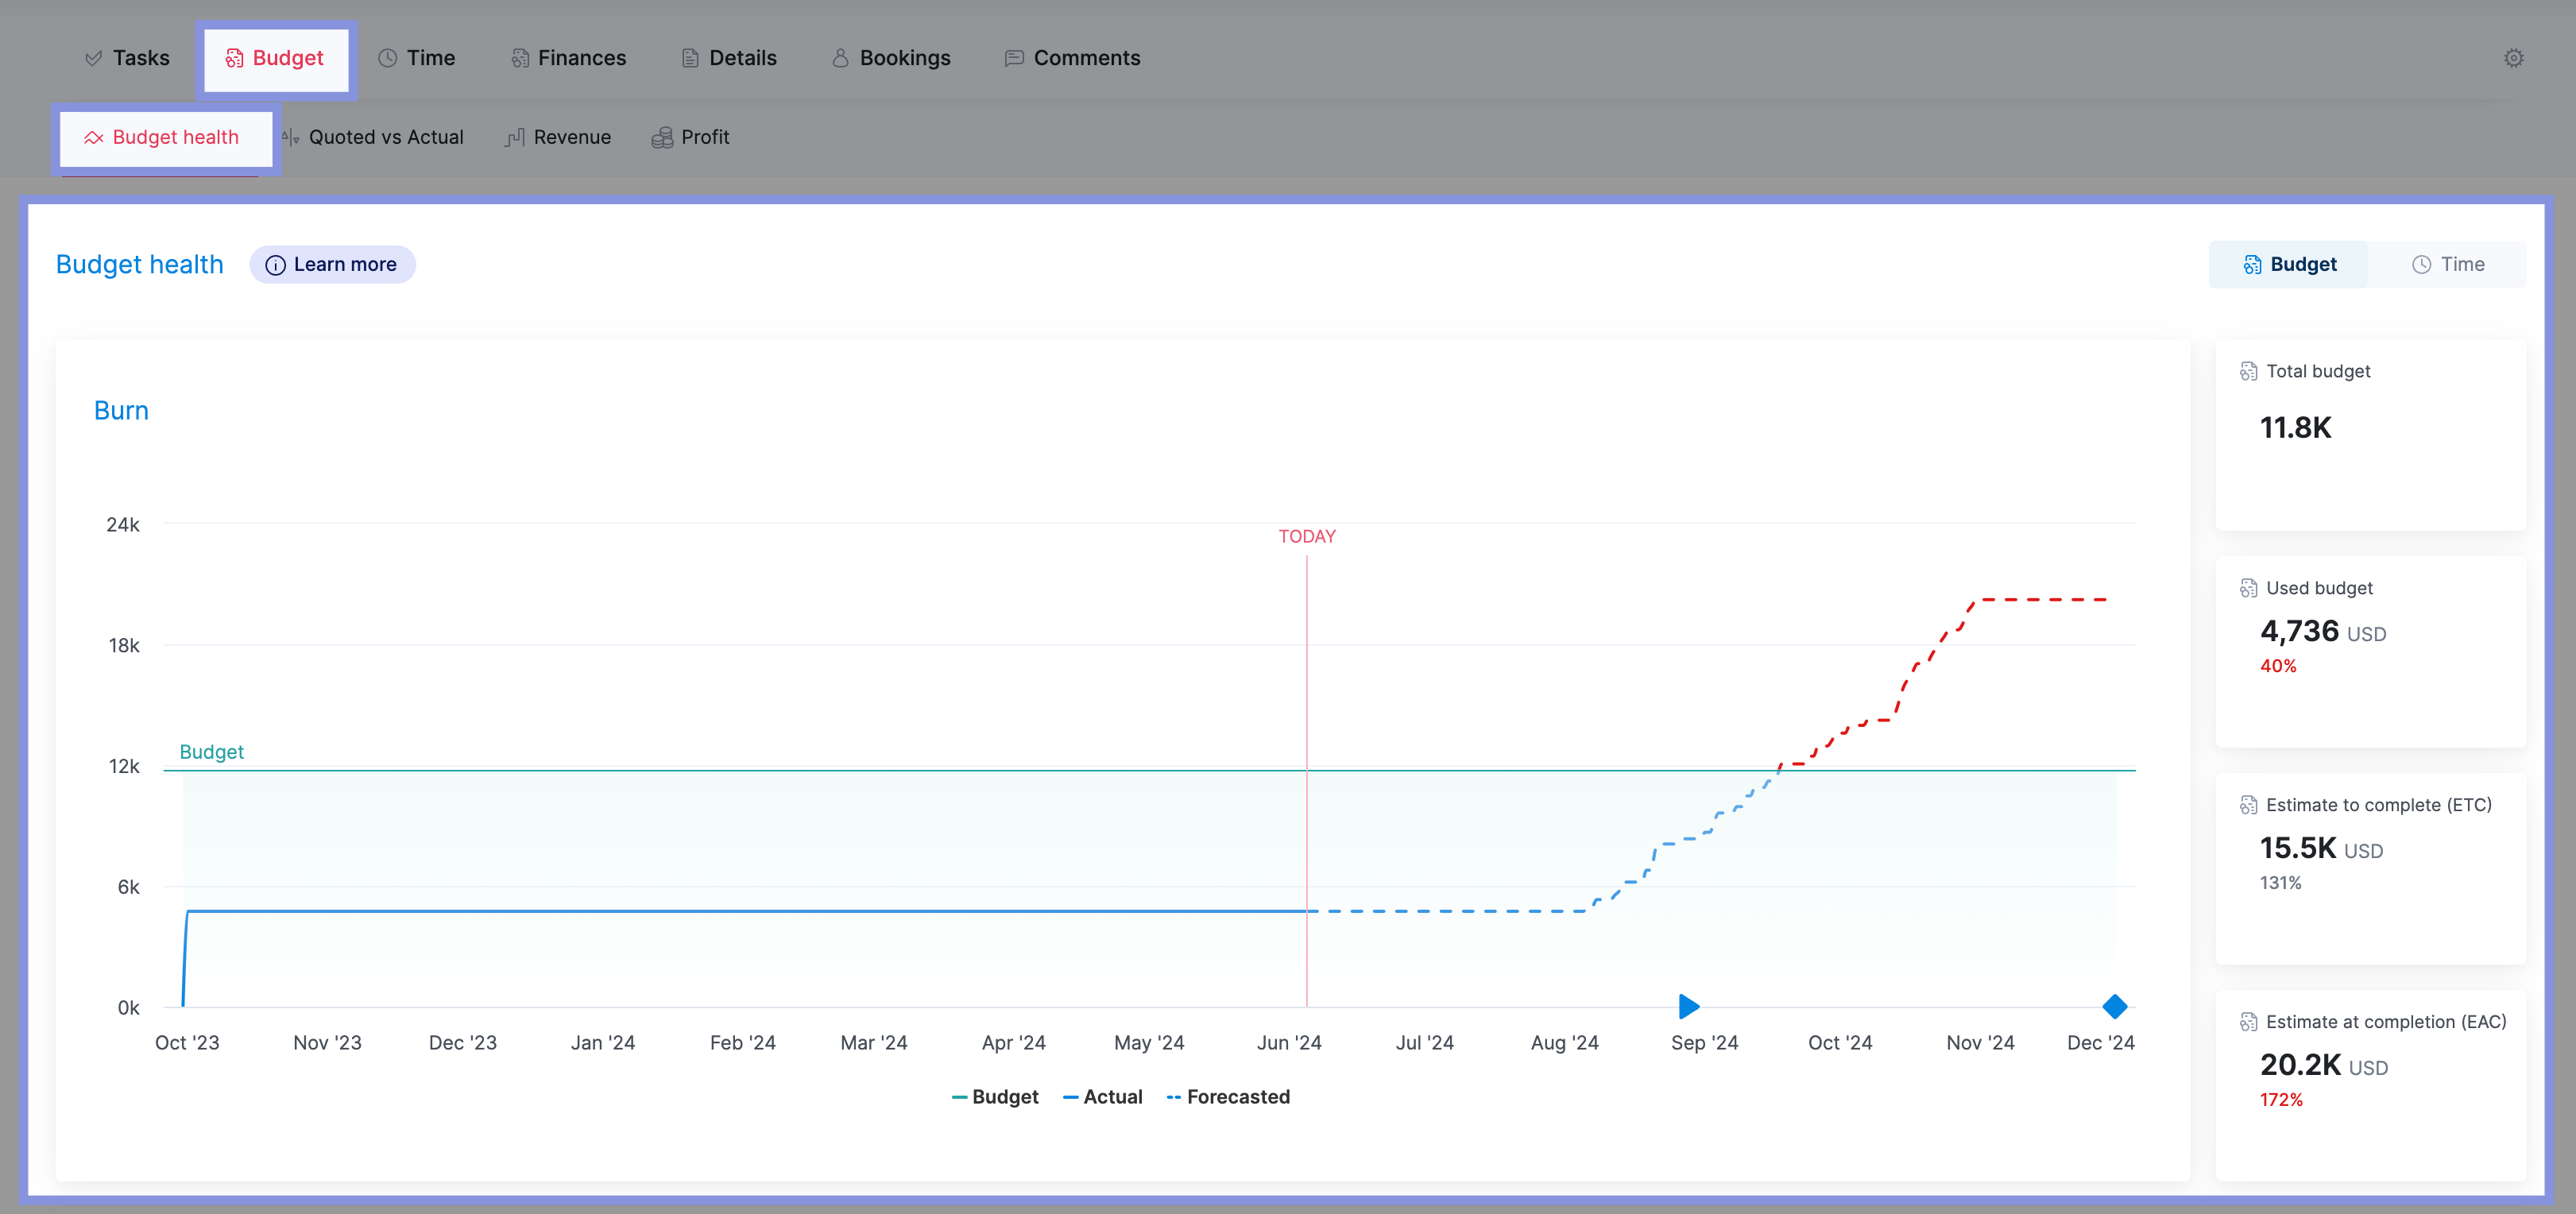
To see your Burn-up chart, click on the “Budget” tab, followed by “Budgert health”
The Burn-up chart in the “Budget health” section tracks all project-related activities. It shows your project’s budget progress over time so that you can analyze the burn rate.
You’ll see data such as:
- Total Budget: The total amount of money allocated to the project.
- Used Budget: The amount of the budget already spent.
- Estimate to Complete (ETC): The estimated amount of money needed to complete the remaining project tasks.
- Estimate at Completion (EAC): The total estimated project cost, including both used and remaining budget.
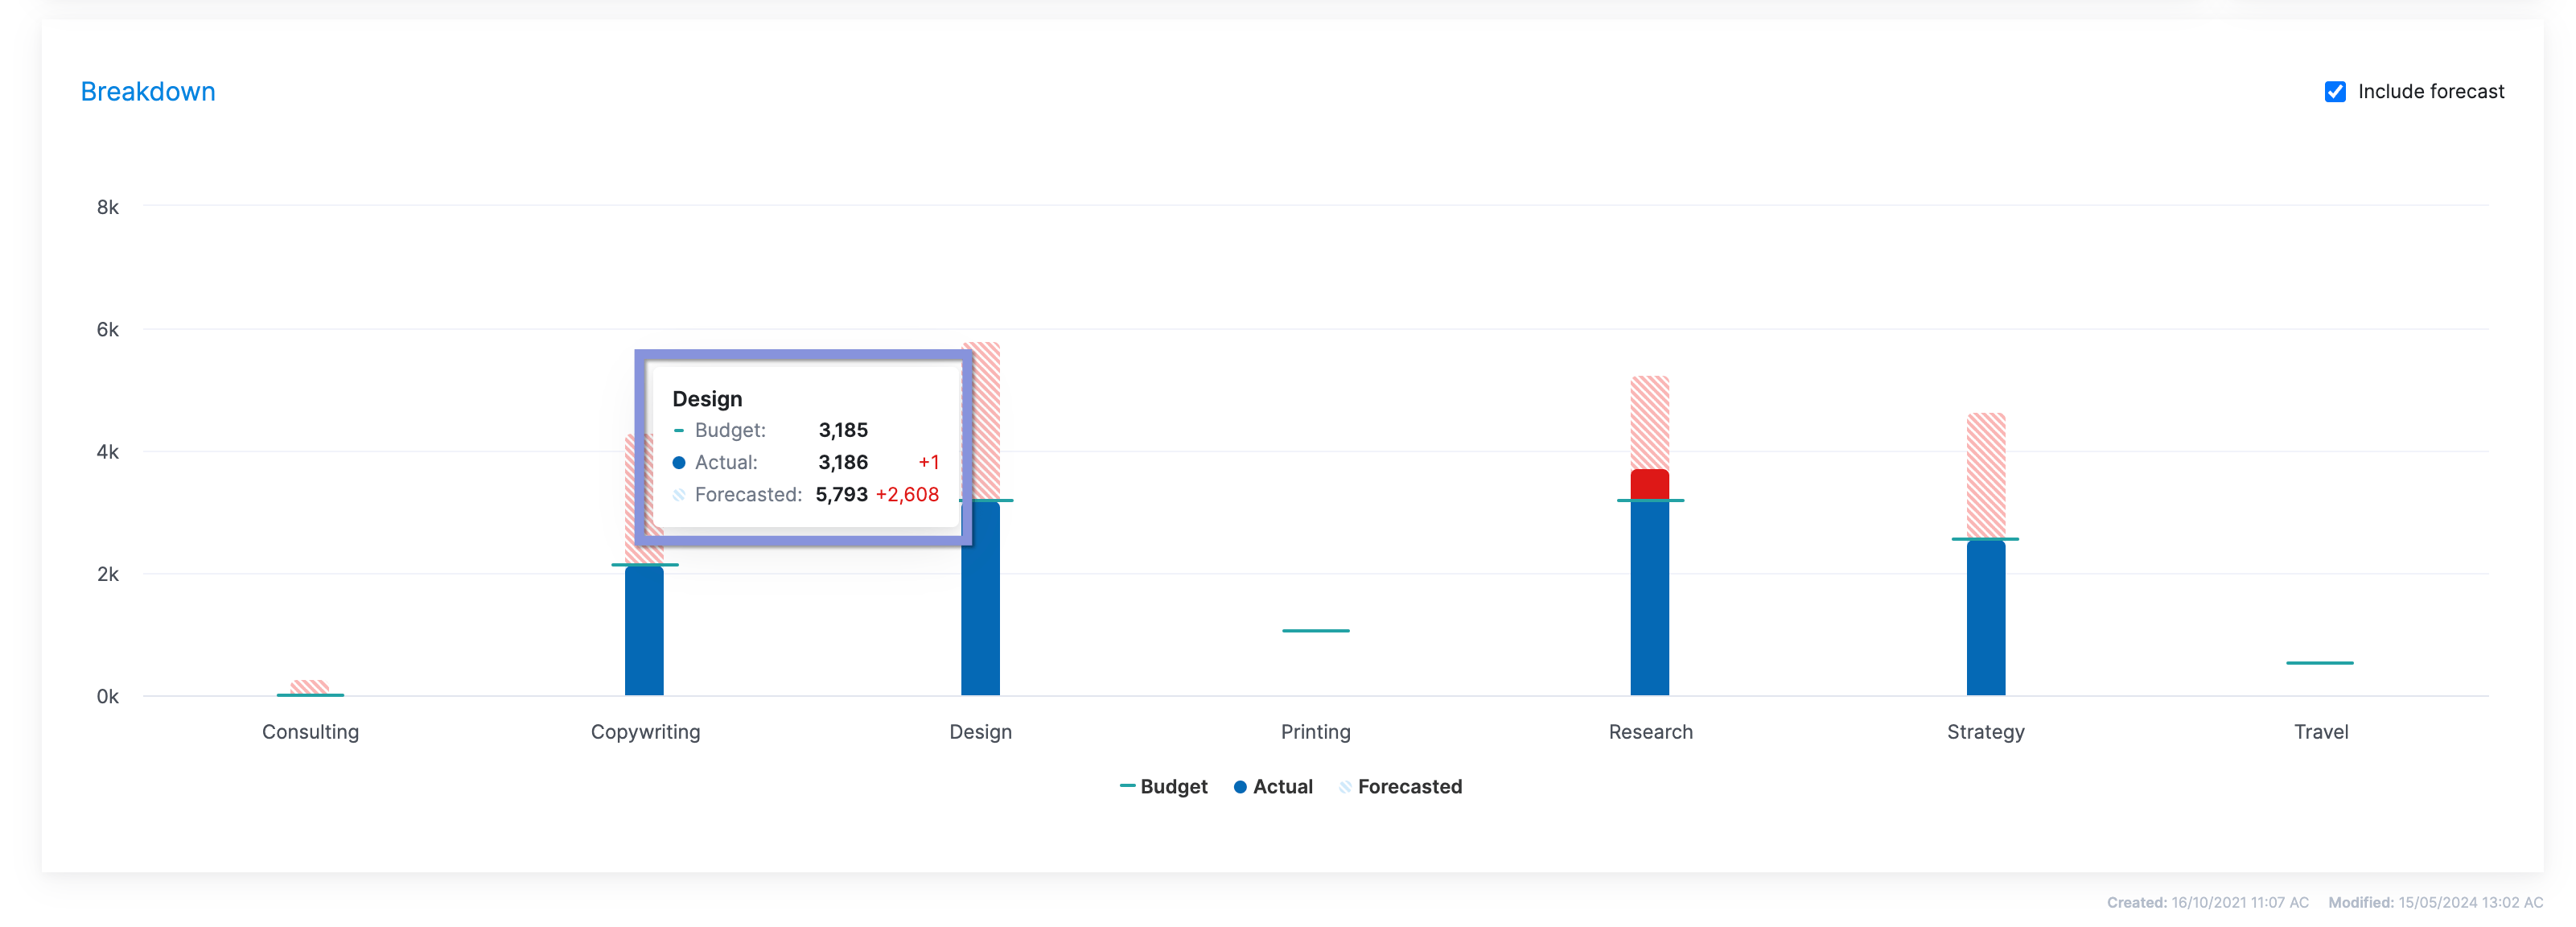
Scroll down, and you’ll also see a breakdown of the services included in that project. Hover over any service to see its budget, actuals, and forecasted numbers.
Use this knowledge to make decisions to get things back on track, such as reallocating work. Or renegotiating the project scope to protect your margins.
4. Analyze your planned vs. actual numbers
The final piece of the profitability puzzle is comparing your planned and actual results. This will allow you to see how well (or poorly) your team used their time and budget.
Whether you exceed or fall short of your targets, you want to learn how to improve from each project.
If you don’t figure out why you went over budget or didn’t have enough people to finish the work on time, the same problems will happen again in future projects.
Over time, these unresolved discrepancies erode your profit margins.
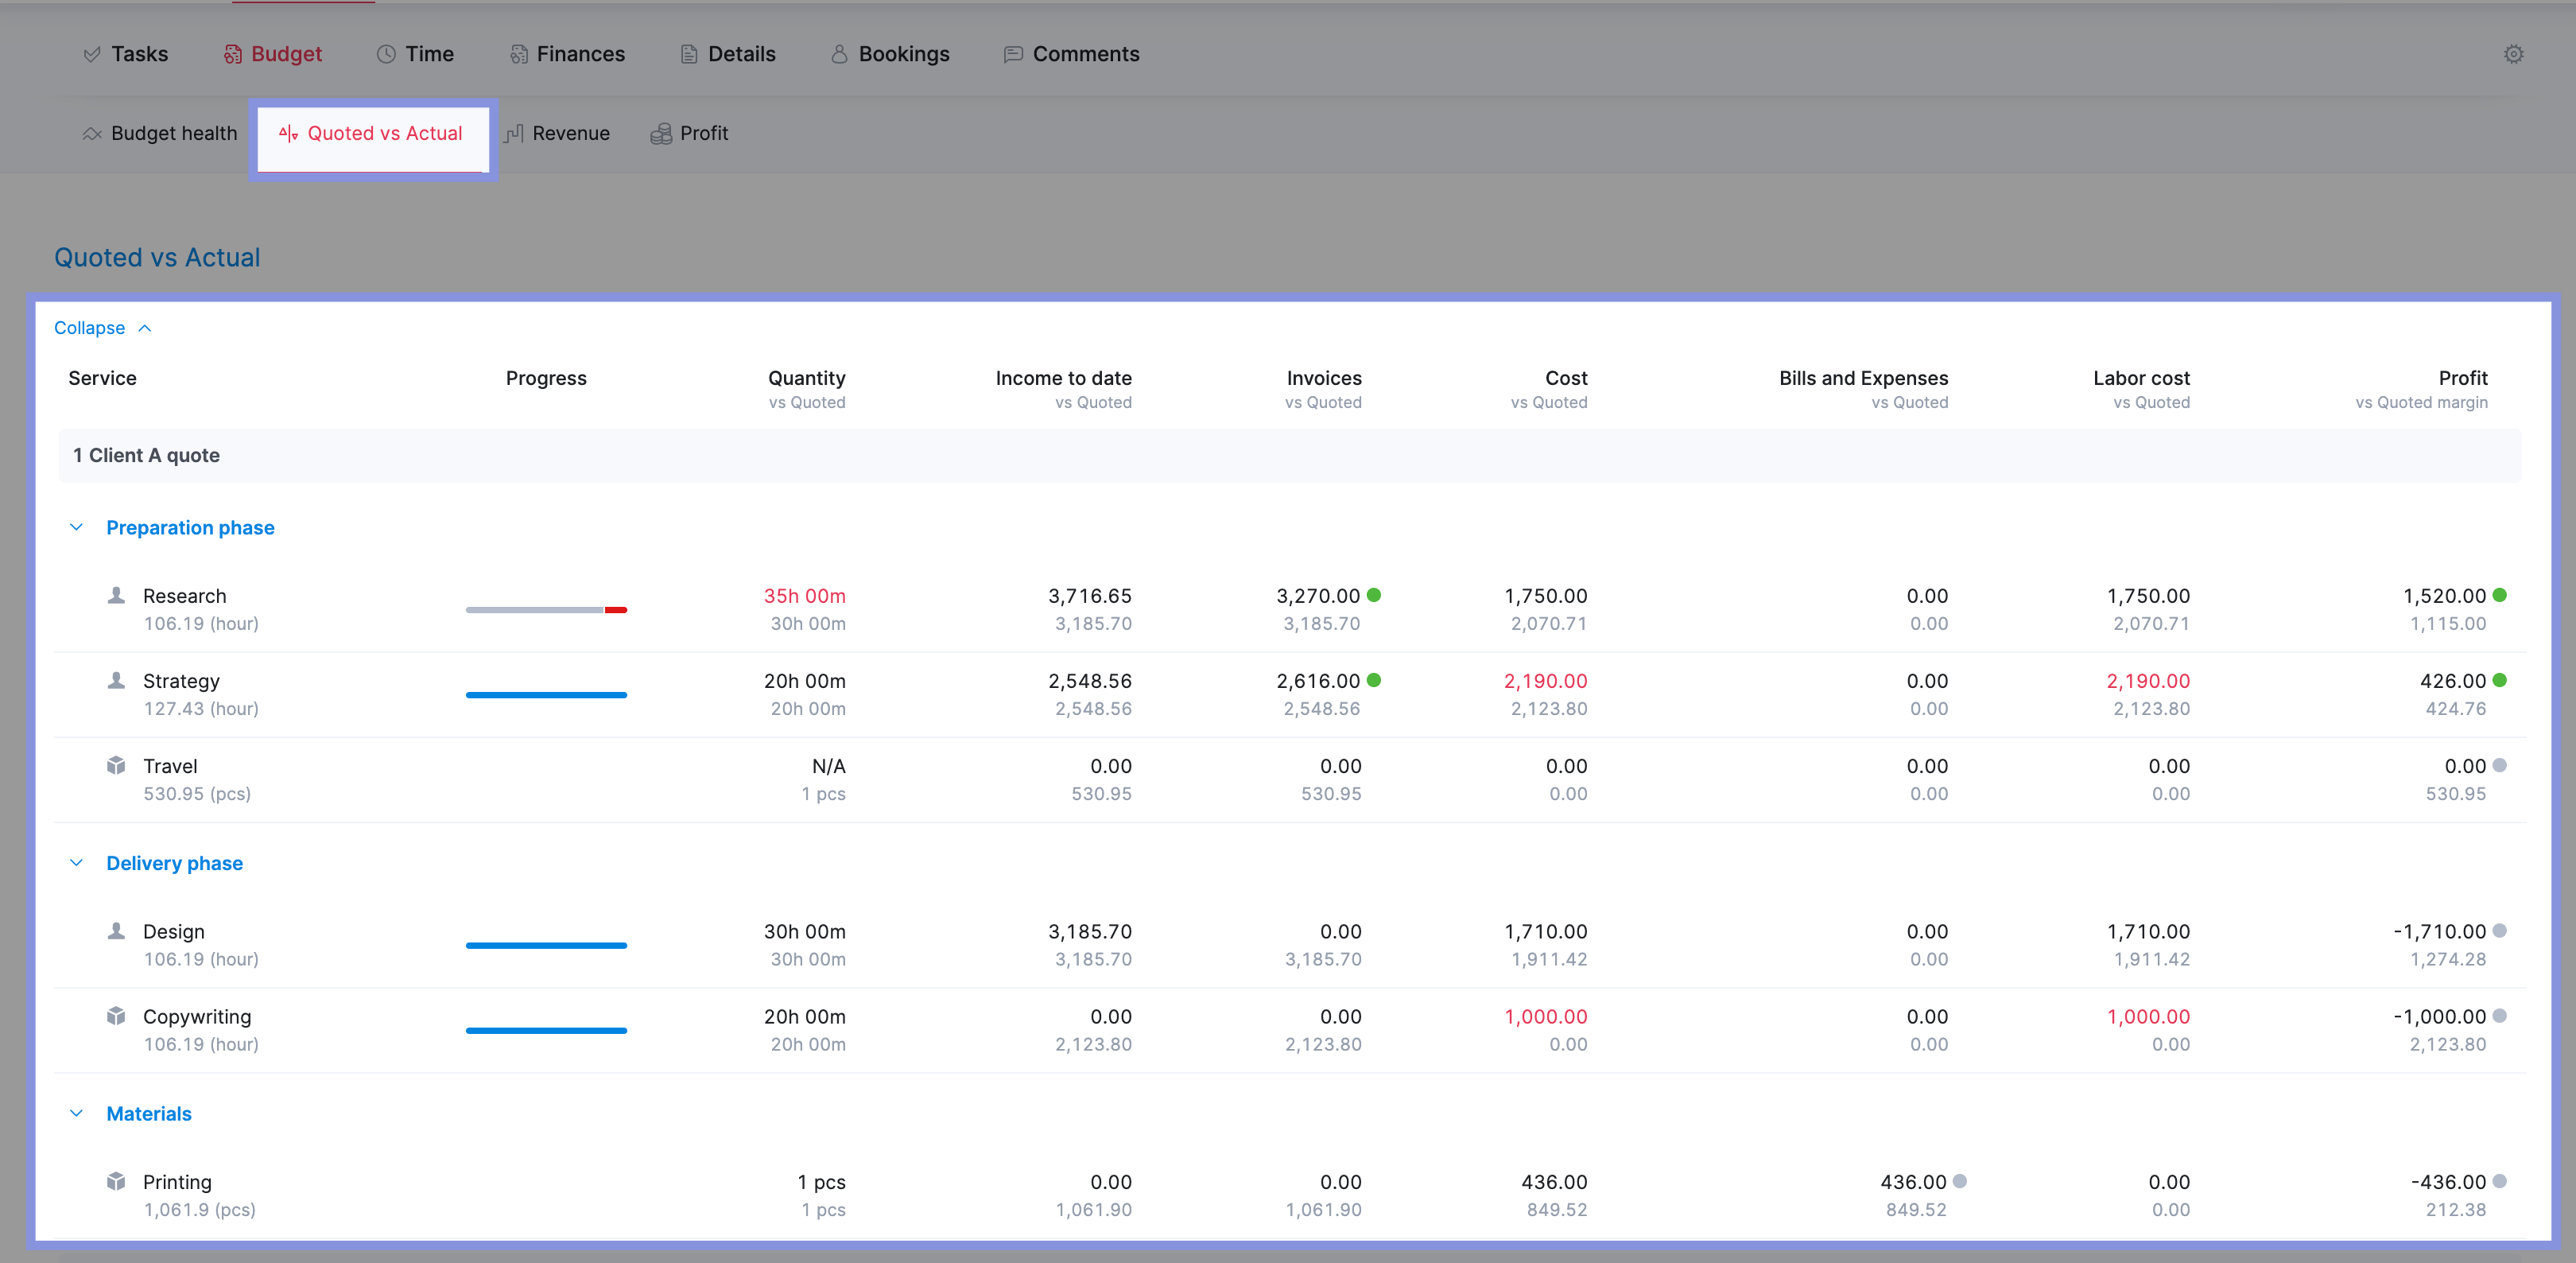
In Scoro, you can see your planned vs. actual numbers for any completed project by clicking the “Quoted vs. Actual” tab within the individual project view.
Here, you’ll see a comparison of your expected revenue and costs (gray text) to what you spent and made on the project (bold) for each phase.
This information is automatically calculated using your quotes and your team’s logged billable hours, bills, and expenses.
When reviewing the data, pay special attention to:
- Overall Profitabilty: Did you achieve your profitability targets? If not, was the deviation due to factors within your control (e.g., labor costs, resource allocation) or external factors (e.g., unexpected expenses, client changes)?
- Revenue Discrepancies: Were your project earnings higher or lower than expected? If so, why? Were there changes in scope, additional services provided, or adjustments to the project fee? Understanding these factors can help refine your pricing and scoping strategies for future projects.
- Labor Costs and Delivery Margin: Did your labor costs exceed your estimates? If so, which tasks or phases took longer than anticipated? Analyze this data to identify potential bottlenecks, inefficiencies, or areas where your team may need additional training or support.
- Expense Surprises: Were there any unexpected expenses that impacted your delivery margin? Review your project expenses to see if any costs could have been avoided or minimized.
- Scope Creep: Did the project scope expand without a corresponding increase in revenue? Identify any tasks or deliverables added after the project started and assess their impact on your profitability.
Say your project’s actual delivery margin was 10% lower than expected. Upon reviewing the quoted vs. actual data, you notice that the design phase took 20% more hours than initially scoped.
Your next steps could be:
- Investigating why the design phase exceeded estimates
- Determining if the scope was unclear or if there were unforeseen challenges
- Adjusting your future quoting process to account for similar design complexities
- Considering negotiating a bigger budget for design-heavy projects
If your project achieved a higher margin than expected, focus on identifying and replicating what brought you that success.
Your team may have delivered the work faster than anticipated because you invested in a new project management tool.
Or you were able to successfully negotiate additional fees during the project to account for increased scope or extra revisions requested by the client.
If you’re having trouble pinpointing the “why,” ask yourself the following:
- Did you price the project optimally?
- Did you accurately estimate the time and resources needed?
- Were there any process improvements or efficiencies that boosted productivity?
- Did you manage scope creep and client expectations?
Improve your project profitability with Scoro
Calculating and tracking project ROI is just one piece of managing and improving your overall profitability.
With Scoro, you can go much further. Use our customizable dashboards and real-time reports to streamline workflows, optimize resource allocation, identify areas for cost reduction, and maximize ROI for future projects.
Take it from Cosmonauts & Kings—this political comms agency boosted their billable utilization and cut overservicing by using our automated work management platform.
See how Scoro can help your own org by signing up for a free trial today.