

Revenue forecasting is the process of estimating how much income your business is likely to generate over a specific period—usually monthly, quarterly, or annually.
For professional services firms, that means predicting revenue based on your current projects, upcoming proposals, and the expected timing of work delivery.
When done accurately, revenue forecasting helps you answer critical questions like:
- Do we have enough work lined up to cover the next few months?
- Are we on track to hit our sales or growth targets?
- Can we afford to hire, bring in freelancers, or do we need to scale back?
In this guide, you’ll learn why revenue forecasting matters, what inputs you need to do it well, and how to follow a five-step, bottom-up forecasting process tailored to agencies, consultancies, and other service based business’s.
Let’s dive in.
Inputs you need for a reliable revenue forecast
A solid revenue forecast relies on a few key inputs. These help you understand what income is already confirmed, what might be coming, and how trends could shape the future.
Here are the three main data points to include:
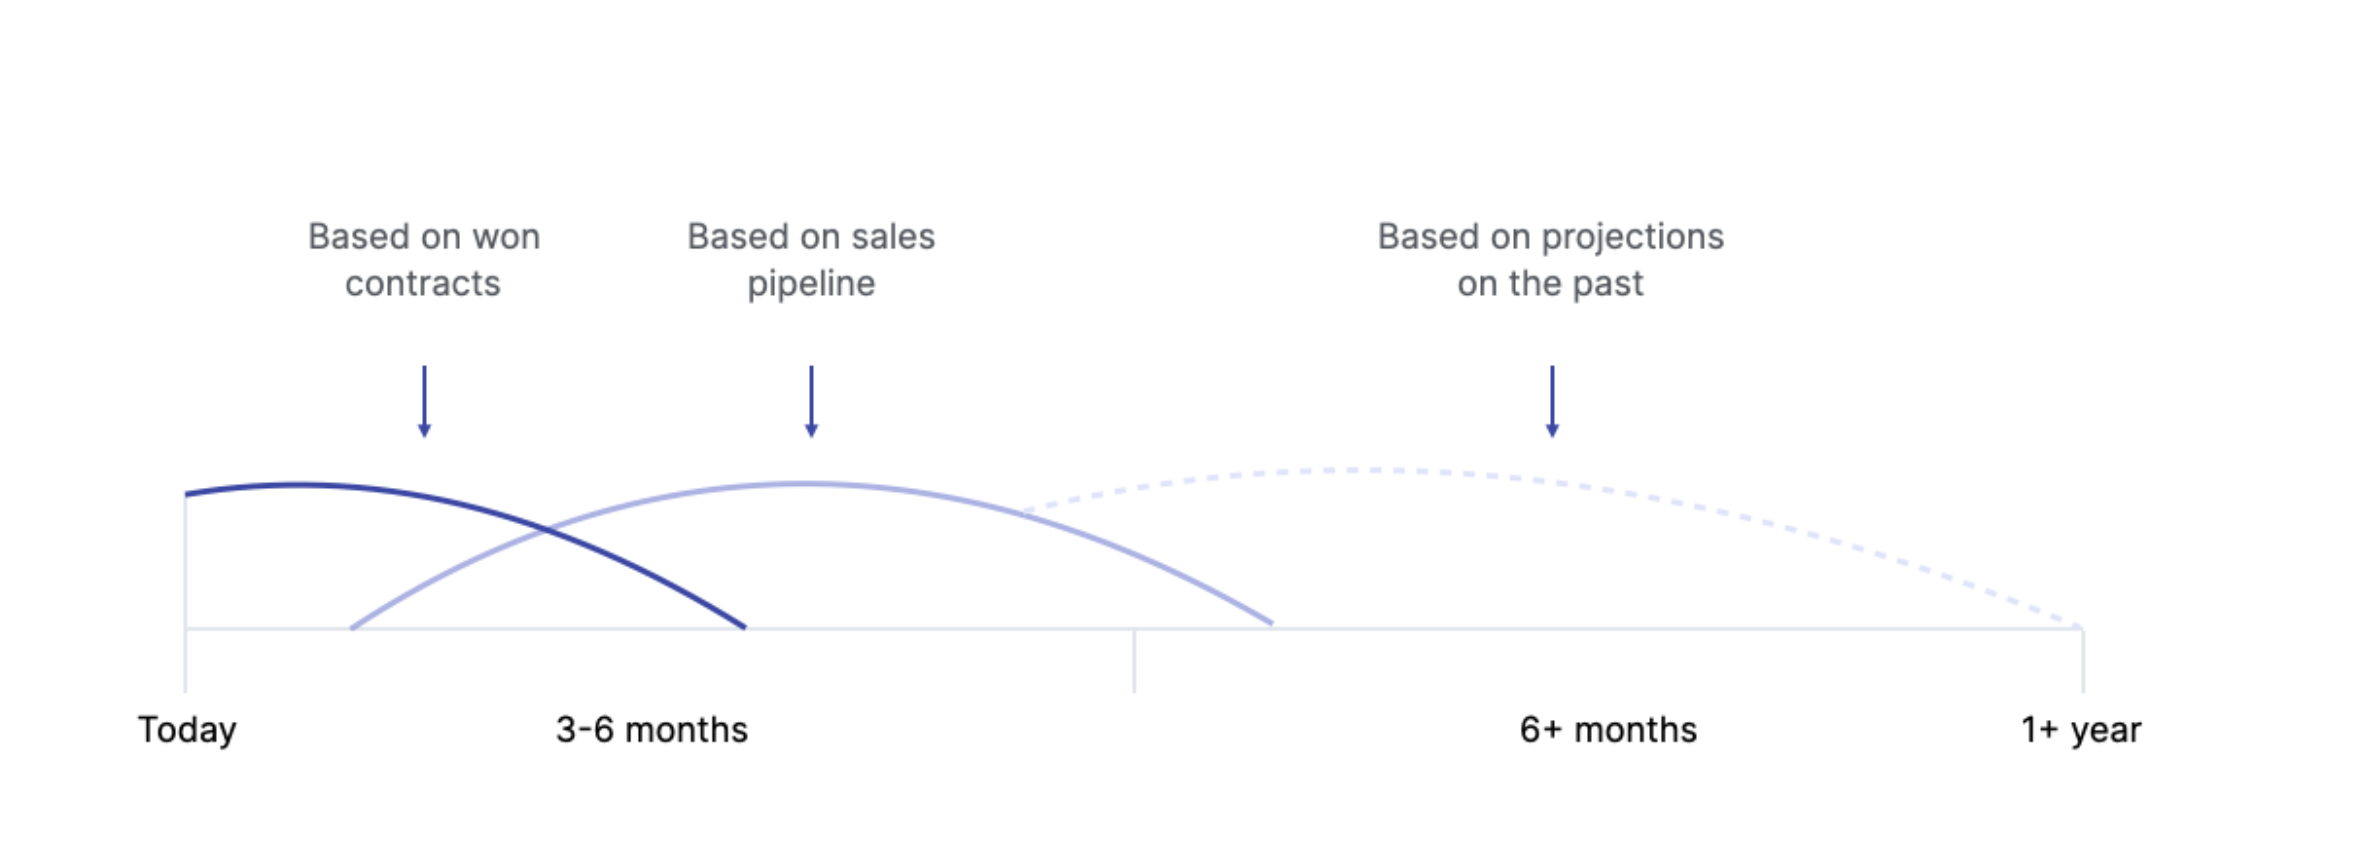
- Your won contracts: Add any active or upcoming projects that have been signed. To keep things accurate, spread the revenue across the months when the work will actually be delivered—not just when the contract was signed or invoiced.
- Your sales pipeline: Include proposals, quotes, or contracts still in progress. You can also forecast based on win certainty (i.e., including 80% of the projected revenue for 80% of certain contracts, 50% revenue for 50% of certain contracts, etc.).
- Your historical performance: Use past financial results to help shape your forecast as well. For example, if you normally earn 25% more revenue in Q4, factor that in—even if it’s not confirmed yet.
Why is forecasting revenue important?
Accurate revenue forecasting helps you:
- Plan your finances with confidence: Know how much revenue is coming in so you can manage cash flow, budget accurately, and make informed investment decisions
- Sell more strategically: Set realistic sales targets, time deals based on delivery capacity, and adjust pricing or offers during slower periods
- Hire at the right time: Understand when to scale your team, bring in freelancers, or pause hiring based on projected workload and income
Revenue forecasting models for professional services
There are two primary models used for revenue forecasting: top-down forecasting and bottom-up forecasting.
Top-Down Forecasting
Top-down forecasting is a broad approach that relies on your past financial performance, the total addressable market (TAM), your company’s market share, and other external factors to estimate revenue.
A basic formula for top-down forecasting is Revenue = Market Size × Market Share Assumption.
Imagine you run a marketing agency and want to predict how much money you’ll make next year.
You’d start by looking at the TAM and your market share.
For example, in 2022, US companies spent nearly $481 billion on marketing services. If you estimate that your agency captures about 0.5% of that market, then your estimate would be:
$481 billion (TAM) x 0.5 (your market share) = $25 million (your agency’s projected revenue).
Of course, this is just a high-level estimate. You can refine the forecast further based on other market predictions, reports, and company insights.
Say you only captured 0.5% of the market last year. But recently, a major competitor closed. So, it would make sense to increase the market share you plan to capture this year. And factor that into your revenue calculation.
| Pros of top-down forecasting | Cons of top-down forecasting |
|---|---|
| ✔️Simple, high-level method | ❌Can be inaccurate because it relies on general trends instead of business specifics |
| ✔️ Good for long-term predictions and goals, such as annual planning | ❌Often presents overly optimistic forecasting |
| ✔️ Offers the ability to forecast without much internal data | ❌Overlooks a number of important factors, such as resources available, sales pipeline, etc. |
Bottom-Up Forecasting
Bottom-up forecasting is a more granular approach that uses concrete data to forecast revenue, such as signed deals, pipeline value, available resources, and planned expenses.
A basic formula for bottom-up forecasting is Revenue = Projected # of Sales x Average Sale Price.
Say your agency’s average deal value is $10,000. And you’re on track to close 12 new sales in the next six months. So, your forecasted revenue would be $10,000 (average deal) x 12 (new sales) = $120,000.
To achieve a more precise forecast, you could gather data across planned projects, including:
- Projected total hours for each project
- Known project costs, including labor costs and expenses
- Projected revenue of each contracted project
- The average number of contracts for the given time period
- Average revenue from past contracts or projects
- The total pipeline value
These numbers factor into your calculations to provide more clarity.
For example, you might subtract known project expenses from forecasted revenue to understand how much of your revenue is likely to be profit.
Or, if you don’t have projected data for future sales, you could use an average number of contracts for each quarter to forecast instead.
But if you don’t have clear data on all your anticipated projects, you can use historical data to fill in the gaps.
For example, if you expect to close three new website redesign projects that haven’t been scoped or quoted yet, use the average revenue from past redesign projects for your estimates.
| Pros of bottom-up forecasting | Cons of bottom-up forecasting |
|---|---|
| ✔️ Greater accuracy because it’s based on your actual and historical data | ❌ Can be time-consuming to collect and analyze data |
| ✔️ Good for short-term predictions, such as monthly or quarterly planning | ❌ Can be tricky to forecast long-term accurately (e.g over six months) |
| ✔️ Helpful for companies with uncertain or fluctuating revenue since projections are based on concrete data | ❌ Not as helpful for setting long-term goals, as it focuses on internal data vs. broader market trends |
Top-down vs. bottom-up: What’s the best?
Top-down and bottom-up revenue forecasting are both valuable. But offer different advantages:
| Top-down forecasting is best for… | Bottom-up forecasting is best for… |
|---|---|
| Long-term forecasting (six months and beyond) | Short-term forecasting (six months and under) |
| Businesses without access to detailed project and sales data | Business with access to detailed project and sales data |
| Stable businesses with reliable revenue and market share | Volatile or new businesses with fluctuating revenue |
| Setting high-level sales goals and targets | Generating accurate estimates to inform sales tactics and targets |
Combine both approaches to get the best view of your financial future on both macro and micro levels. The top-down approach helps you set your long-term financial plan and goals. And the bottom-up approach helps you stay on track to meet them.
How to forecast revenue for your service business
Here’s a five-step bottom-up revenue forecasting process that gives you visibility and control:
1. Define your forecasting period
Start by choosing how far ahead you want to forecast.
Most professional services businesses forecast monthly or quarterly:
- Monthly forecasts help you manage upcoming work, cash flow, and team capacity
- Quarterly forecasts help you plan for bigger-picture moves like hiring, investing in tools, or setting revenue targets for your team
Choose a time period that matches how often you make decisions.
If you plan hiring quarterly, forecast quarterly. If you manage team workload month by month, forecast monthly.
2. Review your active projects and pipeline deals
Your forecast should include both active projects (work that’s already started) and potential deals (quotes that haven’t been won yet).
Start by adding active projects as committed revenue—you expect to earn this because the work is already in progress.
Then, add potential deals as pipeline revenue, but apply probability weighting to stay realistic. For example, if a deal is 50% likely to close, include 50% of its value.
Here’s how that looks in practice:
| Type | Project | Quoted value | % to close | Forecasted rev. |
|---|---|---|---|---|
| Active Project | Website Redesign (Client A) | $25,000 | 100% (already started) | $25,000 |
| Active Project | Branding Package (Client B) | $18,000 | 100% | $18,000 |
| Pipeline Deal | Website Project A | $20,000 | 80% | $16,000 |
| Pipeline Deal | Website Project B | $30,000 | 50% | $15,000 |
| Pipeline Deal | Website Project C | $40,000 | 25% | $10,000 |
| Total Forecasted Revenue | $133,000 | $84,000 |
So instead of forecasting the full $133,000, you’re forecasting $84,000 based on what’s confirmed and what’s reasonably likely to close.
You can start building this in a spreadsheet by listing each project or deal, assigning a probability, and calculating the weighted revenue manually.
This works well when you’re just getting started, but it can become hard to maintain over time.
But professional services automation (PSA) tools like Scoro make this process faster and more dynamic.
The “Revenue Report” automates this process using a bottom-up approach. It pulls real-time data from:
- Committed revenue from active projects (in dark blue)
- Pipeline revenue from quotes, distributed across future months based on the estimated delivery timeline (in light blue)

Underneath in the “Quote / Project” section, the monthly breakdown is based on each project or quote, showing you exactly where your revenue will come from.
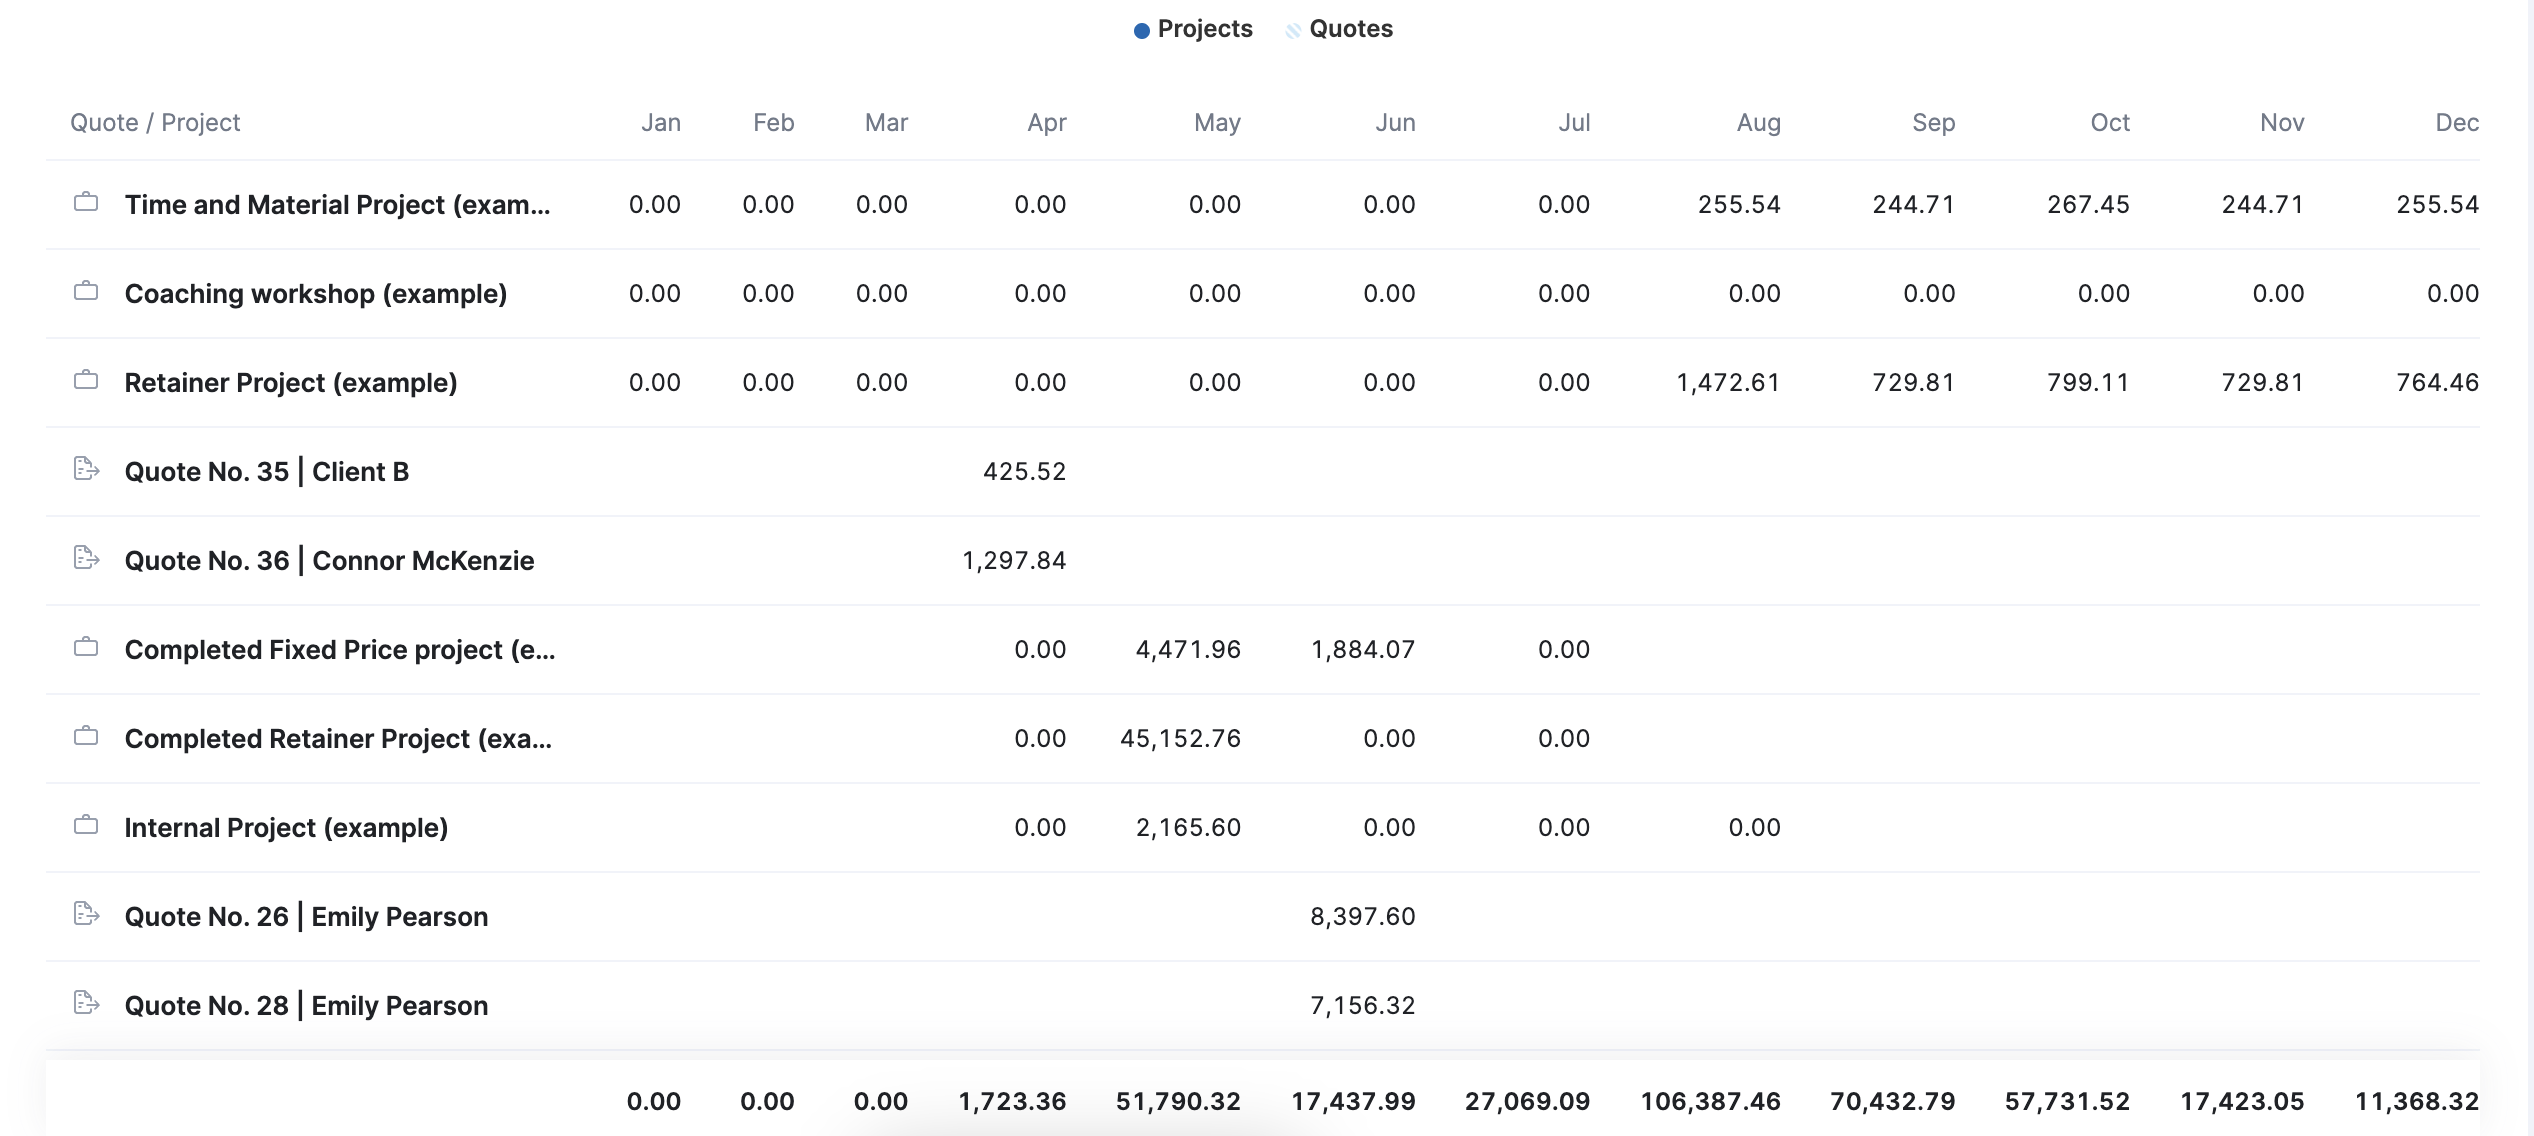
This can help you make more effective decisions about when to increase your pipeline and which quotes or projects to prioritize.
You can also filter the “Quote status” to only include quotes in the “Opportunity” stage for a more reliable forecast.
This acts as a built-in safeguard, similar to applying probability weights manually.
By focusing only on deals that are still active and likely to close, you avoid inflating your forecast with quotes that aren’t likely to close.

Top Tip
Scoro has plans to support top-down forecasting too, using historical performance to help you set high-level goals and spot long-term trends—giving you a complete view from both angles.
3. Align revenue with delivery timelines
Revenue shouldn’t all be assigned to the month you sign a deal.
Instead, spread it across the months when the work will actually be delivered.
For example, if you win a $90,000 project in April that runs from May to July, divide the revenue across those three months:
| May | June | July |
|---|---|---|
| $30,000 | $30,000 | $30,000 |
This keeps your forecast accurate, especially when timelines shift. If a project gets delayed by a month, your revenue should shift with it.
Scoro helps you align revenue with delivery automatically. Starting from the quote stage.
When you create a new quote, use the “Estimated duration” box to tell Scoro how to distribute the projected revenue in your forecast.
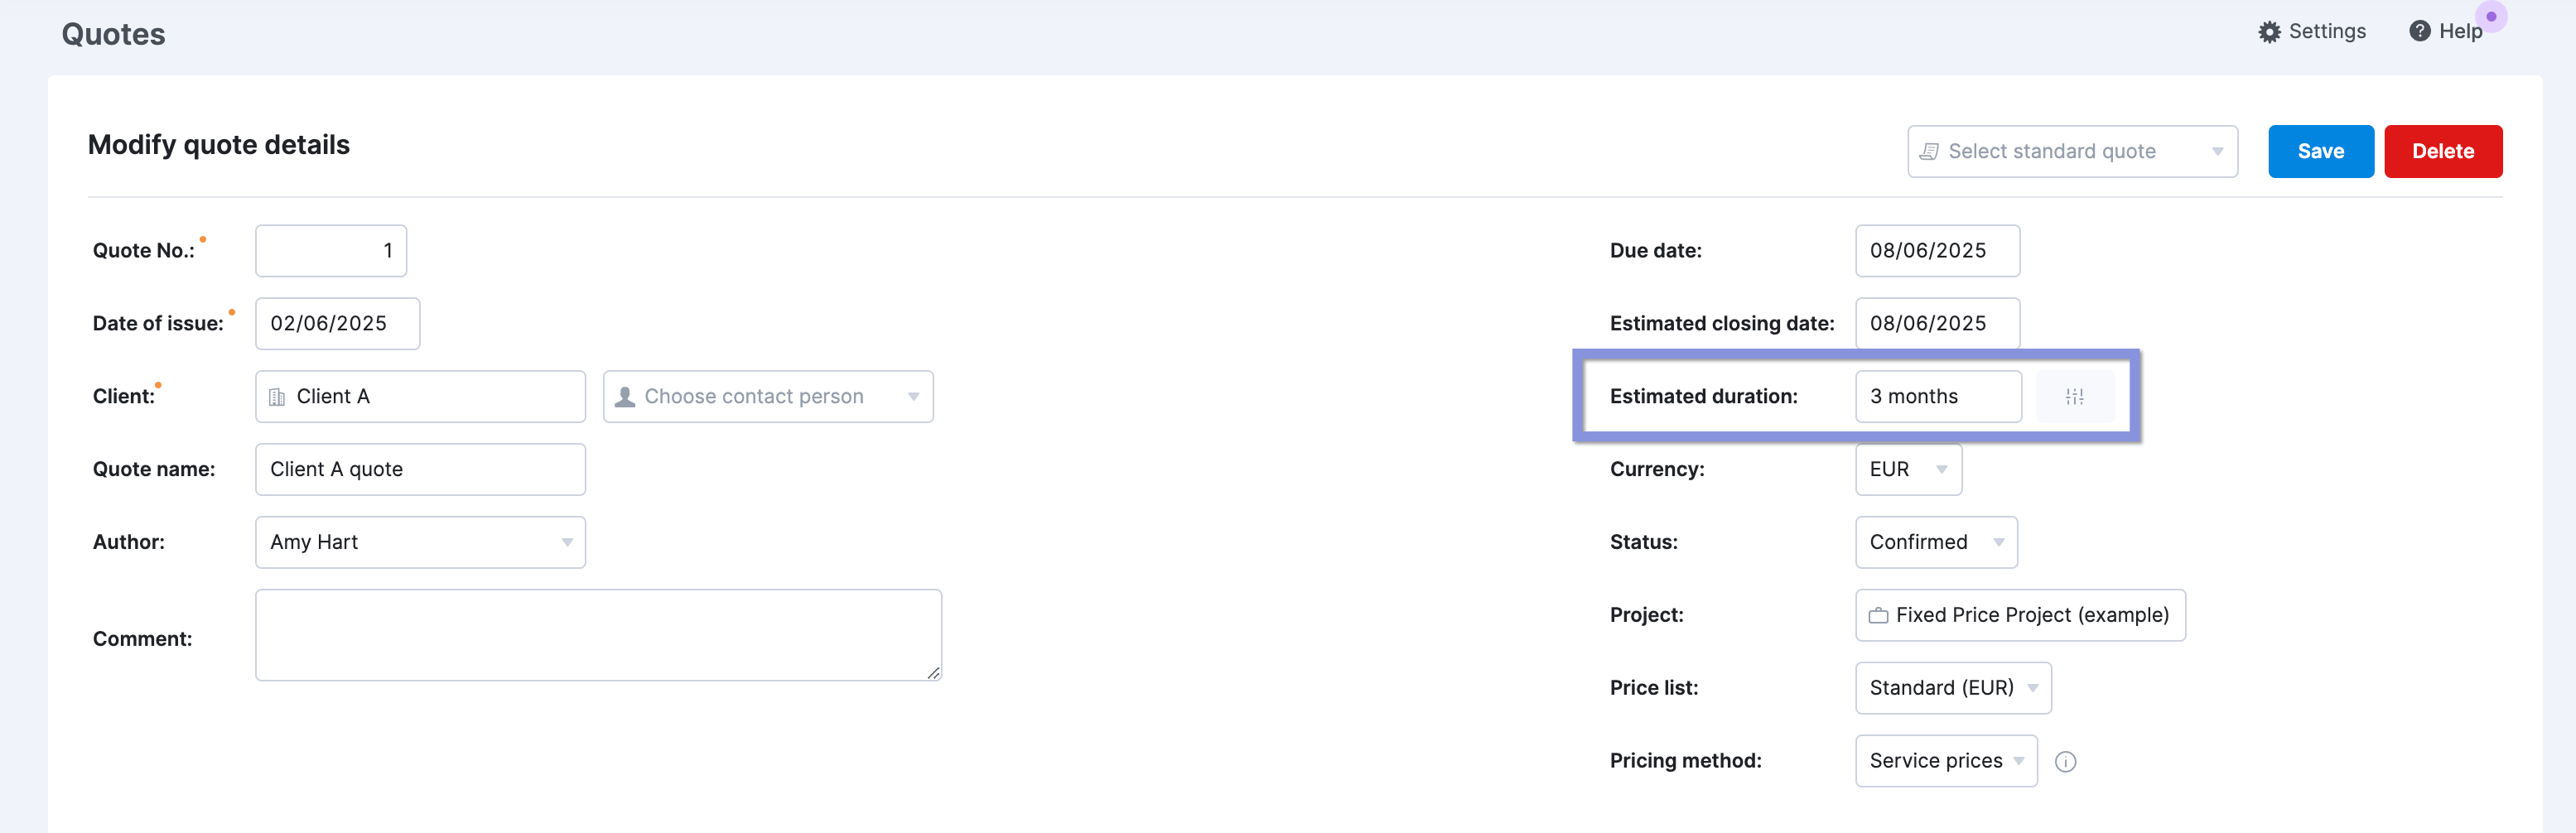
As soon as you adjust the number of months, Scoro will automatically redistribute the quoted sum equally across those months.

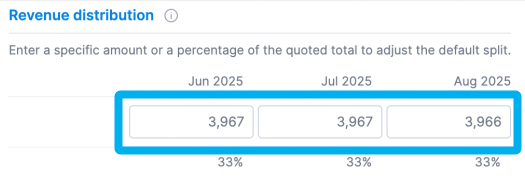
If you know your total revenue will be distributed differently (e.g., in two 50% payments, in full at the close of the project, etc.), manually adjust it under the “Revenue distribution” header:
4. Compare your forecast with targets or goals
Once you’ve built your forecast using real project and pipeline data, step back and look at the bigger picture.
Ask yourself:
- Is this enough revenue to cover salaries and overhead next quarter?
- Are we likely to hit our quarterly or annual sales targets?
- If not, do we need to win more work—or delay hiring?
Use your goals as a reality check.
If your forecast falls short, that’s your cue to increase your sales pipeline, adjust timelines, or rework project scopes.
For example, let’s say your forecast for Q3 shows $480,000 in revenue across current projects and likely pipeline deals.
But your internal goal for Q3 is $600,000 to fund a planned new hire and a marketing push.
You now know you’re $120,000 short.
That gives you a clear next step:
Either upsell current clients, delay those investments until the revenue is secured, or try to increase your pipeline with a few more proposals.
Struggling to build a consistent pipeline?
In this episode of The Handbook, sales expert Ryan Hall shares how to build a reliable sales system that supports accurate forecasting:
- Why many agencies struggle: Over-reliance on inbound leads and referrals
- How to structure your sales engine: Break it into top, middle, and bottom funnel tactics
- Why process matters: Systemizing your tools and workflows leads to more predictable revenue
- Sales is part art, part science: The best teams combine relationships with data
5. Track progress and refine monthly
Forecasting is not a one-and-done activity. As projects evolve and deals progress, your forecast should too. Regularly compare forecasted vs. actual revenue to refine your assumptions and stay aligned with reality.
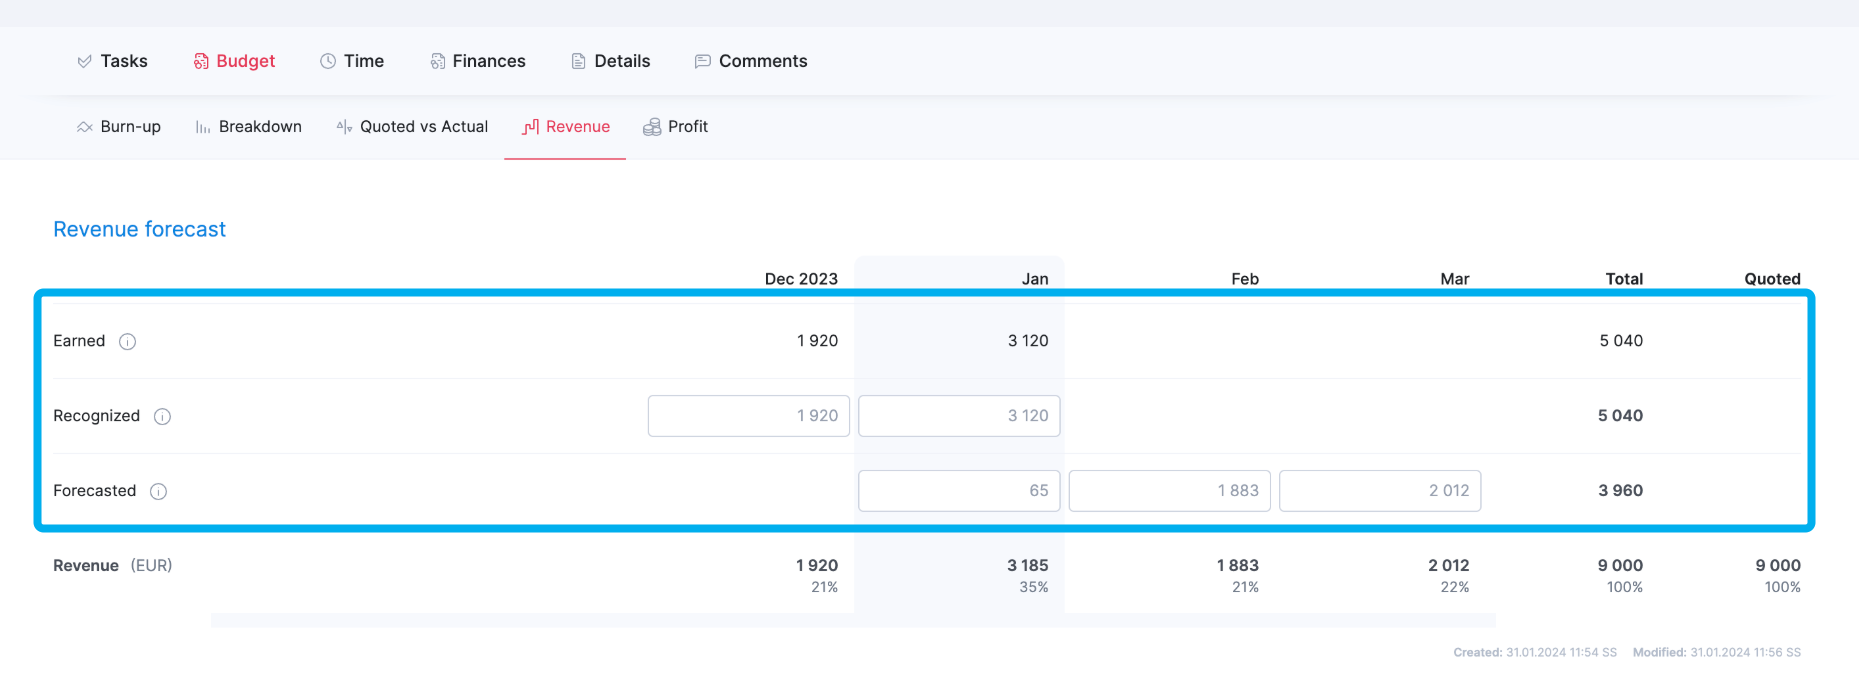
Once a quote becomes a project, Scoro automatically distributes the budget across the timeline using equal split logic.
You can review and adjust this under the “Revenue” tab in the project’s “Budget” section.
Scoro breaks revenue into three categories:
- Earned: Revenue earned based on actual hours logged (auto-calculated, not editable)
- Recognized: Revenue you’ve delivered and want to report. You can overwrite it to reflect what’s been delivered to the client.
- Forecasted: Remaining revenue, calculated automatically based on the remaining budget and timeline. You can also edit these fields to better match expected delivery.
This breakdown helps you match your forecast to real work progress—and keep the “Revenue Report” up to date without manual recalculations.
Keep these calculations accurate by tracking time spent on each project and project deliverables in Scoro.
If you don’t, it’s easy to over-forecast your confirmed revenue.
Say you have a website redesign project worth $100,000 that’s supposed to wrap up in July.
In April, you’ve received $25,000 of that revenue. If you don’t have a way to track that separately, you might accidentally list $100,000 for the future revenue of the project in your forecast— but there’s actually only $75,000 left in future revenue for this project.
When you track your project costs and hours using Scoro, everything is tracked and calculated automatically.
So, you can quickly see accurate revenue forecasts and clear project budgets and know where your cash is coming and going at all times.