

Revenue per employee (RPE) is the net average revenue your employees generate. Net refers to revenue minus pass-through costs, like supplier bills and software licenses.
This metric tells you if your employees create enough revenue to cover:
- Their payroll cost (including salary, benefits, and bonuses)
- Their share of overhead
- Your firm’s desired profit margin
Agencies and consultancies track this metric because it offers insight into:
- Profitability: Confirms if your rates and operational costs are sustainable. If your RPE is too low, you’ll struggle to meet your profit margin goals.
- Efficiency: Reveals whether you need to improve your resource utilization. Higher utilization typically leads to more revenue and higher RPE.
- Scalability: Because RPE factors in your profit goals and payroll costs, you can make hiring and growth plans that don’t compromise your margins.
How to calculate RPE
Calculate RPE using this formula:
RPE = Net Revenue / Number of Employees
When calculating revenue per full-time employee (FTE), use this formula as-is.
Suppose your consultancy’s annual net revenue is $1.5 million. And you have 10 FTEs. Using the formula ($1.5 million / 10), you’d find that each employee generates, on average, $150,000 in net revenue.
When estimating RPE for part-time employees or freelancers, make a simple adjustment. Use full-time equivalents for part-time workers.
Say you have 10 full-time employees who each work 40 hours per week and 10 part-time employees who each work 20 hours per week. Together, they equal 15 FTEs.
Here’s how your RPE might look with the 15 FTEs and an annual net revenue of $2.25 million: ($2,250,000 / (10 + (10 x .5)) = $150,000.
Why traditional RPE benchmarks don’t work
Many agencies and consultancies use a “3x salary” rule to set annual RPE benchmarks. The rule states that each employee should generate enough annual revenue to equal three times their salary.
So an employee who earns a $50,000 annual salary should generate $150,000 in net revenue.
The idea is to have them bring in enough to cover their salary and expenses and still make a profit. Like this:
- Employee salary: $50,000
- Operating expenses: $50,000
- Firm profit: $50,000
While $150,000 is in the average RPE range for professional services organizations, using the 3x salary principle doesn’t work for every firm.
Why?
Because profit per employee benchmarks vary depending on the industry and the firm’s age. Regional salary differences and agency service models (e.g., project-based vs. retainer) also affect this metric.
Most firms can benefit from a profit margin-driven approach instead of using an absolute one-size-fits-all benchmark. It’s more accurate for your specific business because it’s relative to your profit goals.
It acts as a much better proxy for margin and a much more reliable indicator of a healthy ratio between income and costs. Which an absolute benchmark almost always fails to do”
How to set accurate RPE benchmarks for your firm
Use this straightforward three-step process to set relative revenue per employee benchmarks based on your profit margin goals.
As Marcel puts it:
This method bases your RPE targets on actual costs and your profit goals instead of guesswork or broad industry averages. By focusing on net revenue, overhead, and payroll, you’ll get accurate numbers that keep your business profitable.
Step 1: Calculate your RPE
To calculate your RPE, start by using the standard formula above (net revenue divided by number of employees).
Remember: Use net revenue instead of total revenue. If you use total revenue, the formula won’t factor in your costs or help you benchmark your overhead. Which gives you an incomplete picture of your margin.
Step 2: Estimate overhead per employee
Next, calculate overhead as a percentage of net revenue—not as a fixed dollar amount.
Use this formula to calculate your overhead percentage:
Overhead Percentage = (Total Overhead / Net Revenue) x 100%
Say your total overhead is $250,000 and your net revenue is $1 million. Your overhead percentage would be 25% (($250,000 / $1,000,000) x 100%).
When you calculate overhead as a percentage, you can easily compare it to industry benchmarks. For example, an overhead percentage of 20-30% is a typical agency margin that’s considered healthy and helpful for keeping costs under control.
Plus, as a percentage of net revenue, overhead automatically adjusts as your firm’s revenue scales. If you track overhead as a dollar amount, it’s harder to quickly spot problems or grasp the scale of the issue.
But if you know your overhead should be 25% and you see it exceed 30%, you immediately know you have a problem. Your overhead is eating into your profit margin.
Step 3: Determine the required RPE for your profit goal
Once you know your overhead percentage, you can calculate your required RPE.
Use this formula:
Required RPE = Payroll Cost per Employee / ( 1 – Overhead % – Profit Margin %)
Say you want to reach a 25% profit margin, which is in the standard range for agencies. Your required RPE needs to be enough to pay for employee payroll costs and their share of overhead—with 25% left over as profit.
Building on that example, let’s say your overhead percentage is 30%. And your payroll cost per employee is $50,000.
Your required RPE would be $111,111 (($50,000 / (1 – 0.3 – 0.25)). So to maintain a 25% profit margin, each employee would need to generate $111,111 in net average revenue.
Adjusting for various overhead and profit scenarios
You can easily account for different financial scenarios when you use a relative metric (e.g., a percentage) instead of an absolute number (e.g., a dollar amount) for your revenue per FTE benchmark.
By tweaking the overhead percentages and profit margins to fit your business, you can accurately see how much more (or less) revenue each employee needs to generate in different situations.
Adjusting overhead
Say your overhead decreases from 30% to 25% or even 20%—but your payroll costs and desired profit margin stay the same.
Here’s how your required RPE would look with a 20%, 25%, and 30% overhead percentage (given a payroll cost of $50,000 and a desired profit margin of 25%):
| Overhead % | Margin % | Denominator = 1 – Overhead % – Margin % | Required RPE = Payroll ÷ Denominator |
|---|---|---|---|
| 20% (0.20) | 25% (0.25) | 1 – 0.20 – 0.25 = 0.55 | 50,000 ÷ 0.55 ≈ $90,909 |
| 25% (0.25) | 25% (0.25) | 1 – 0.25 – 0.25 = 0.50 | 50,000 ÷ 0.50 = $100,000 |
| 30% (0.30) | 25% (0.25) | 1 – 0.30 – 0.25 = 0.45 | 50,000 ÷ 0.45 ≈ $111,111 |
So if your overhead is 20%, each employee needs to generate $90,909 in net average revenue. And if overhead increases to 25%, each employee would need to generate $100,000 to maintain the same profit margin.
Calculating these numbers makes it easier to plan for the best- or worst-case scenarios while still protecting business stability.
Say the lease for your office space increases, bringing your overhead costs to 35%.
By using the required RPE formula, you can run new revenue numbers for your employees. Or determine if you need to lower your desired profit margin or consider looking for a more affordable office space.
Adjusting profit margins
Use the same formula to run different profit margin scenarios.
Here’s how your required RPE would look with a 20%, 25%, and 30% profit margin (given a payroll cost of $50,000 and an overhead of 25%):
| Profit Margin % | Denominator = 1 – 0.25 (Overhead) – Margin | Required RPE = 50,000 ÷ Denominator |
|---|---|---|
| 20% (0.20) | 1 – 0.25 – 0.20 = 0.55 | $50,000 ÷ 0.55 ≈ $90,909 |
| 25% (0.25) | 1 – 0.25 – 0.25 = 0.50 | $50,000 ÷ 0.50 = $100,000 |
| 30% (0.30) | 1 – 0.25 – 0.30 = 0.45 | $50,000 ÷ 0.45 ≈ $111,111 |
Say you want to earn a higher profit, raising your margin from 20% to 30%. Your required RPE would increase from $90,909 to $111,111.
However, it’s often a good idea to add a buffer to your profit margin calculation.
If a firm’s goal is to get to 25% net profit, they should probably set a target that would get them to 35% if everything went perfectly. As we know, things almost never go perfectly
Strategies to improve RPE
To increase your firm’s RPE, you have to make some strategic changes. This could mean taking a new approach to client acquisition, reviewing resource planning methods, or other tactics.
Here are our top tips:
Target higher-value clients
When you acquire higher-value clients, you generate more revenue per project. So you can increase your profit margins and RPE without spending money on additional resources (e.g., new hires or contractors).
Here’s how to do it:
Focus on niche industries
Identify growing industries that tend to have larger budgets and a need for specialized services (e.g., SaaS or healthcare).
Agencies that specialize in a high-value niche are twice as likely to achieve fast growth and high profitability, according to Wow’s BenchPress 2024 report.
To find potential niches, review your firm’s historical revenue data. Find which projects and clients brought in the most revenue and also maintained strong margins.
Use Scoro’s “Revenue” report for this. Select “Clients” from the “Grouped by” menu to quickly identify your biggest ones.
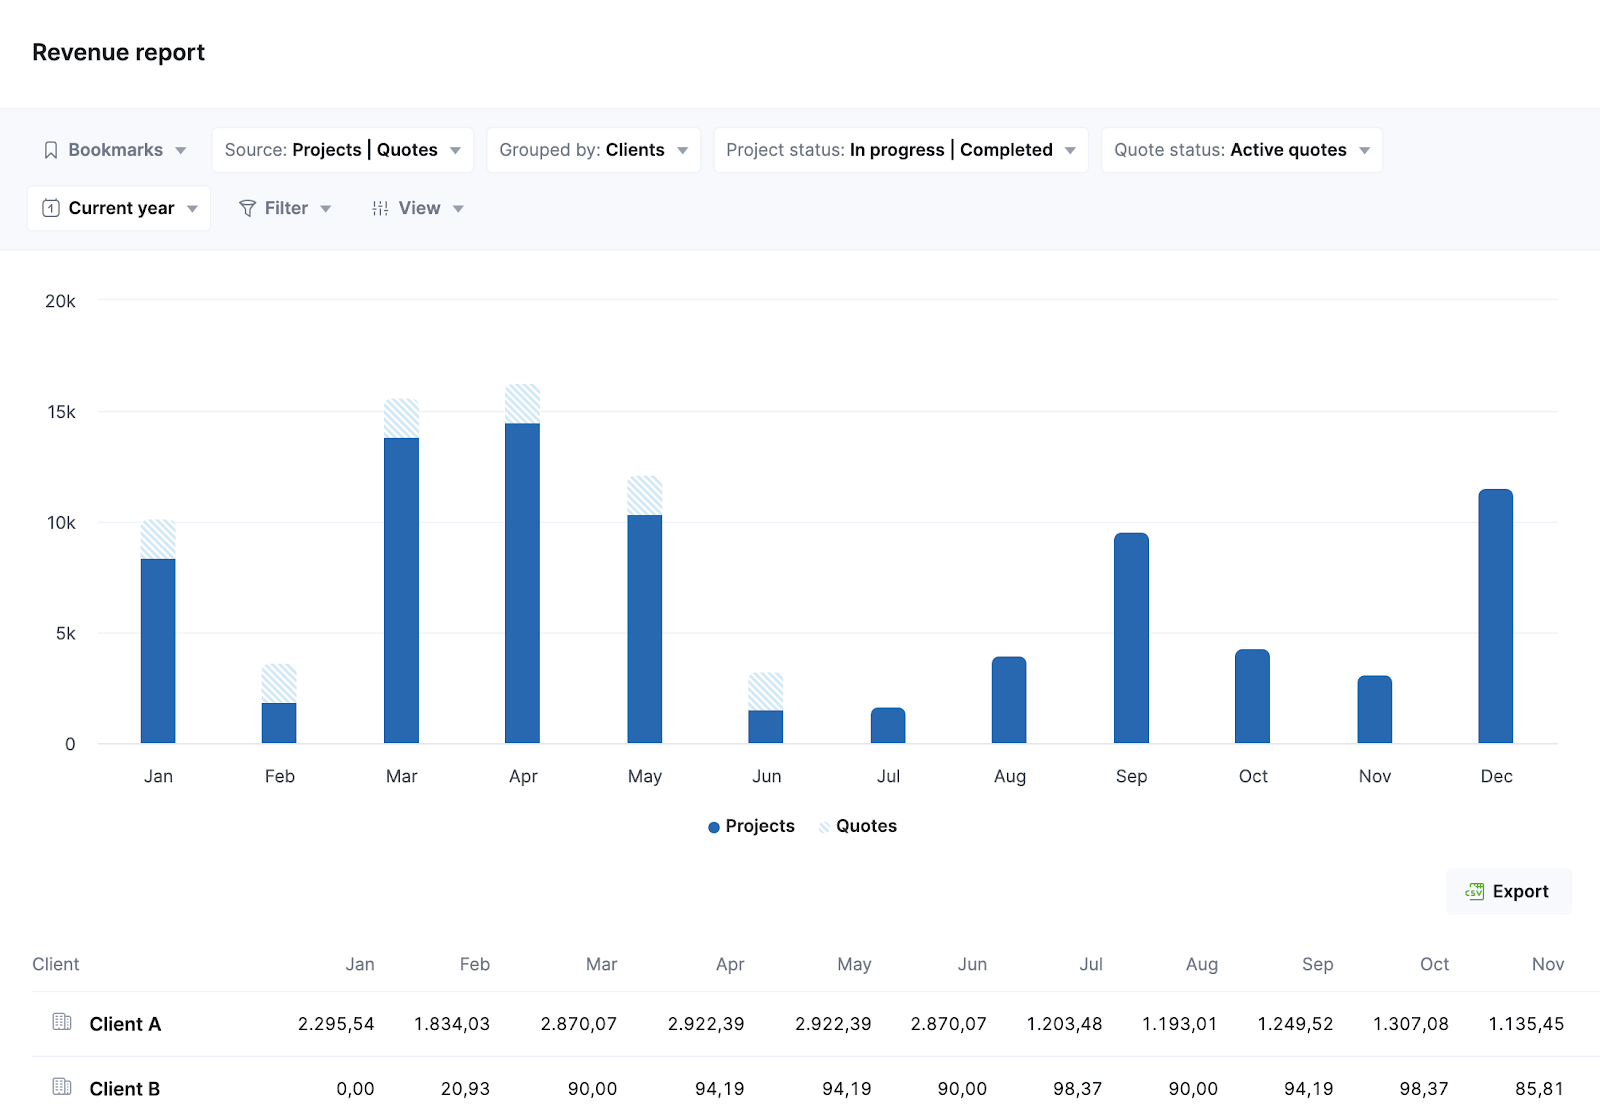
You’ll see revenue month by month. To examine revenue and profit margins for each client’s project in more detail, click on each client.
Build case studies
To position your agency as a top choice for clients in your niche, create a case study library with customer stories.
In each success story, showcase measurable results like ROI or growth metrics. Highlight the value your agency delivers by including data (e.g., “We increased the client’s ROI by 50%”) and direct client testimonials.
Write customer-centric proposals
Become an expert at solving unique client needs or pain points.
Then, emphasize how you solve those specific problems in your pitches. Like helping SaaS start-ups grow their web traffic with SEO. Or helping healthcare brands build engaged social media communities.
And make sure you focus on ROI instead of tactics. By honing in on results instead of task details, you can show the true value of what your team will achieve.
Further listening
Struggling to pitch and win clients? Check out our podcast episode with Freia Muehlenbein, an agency growth consultant and owner of Be Reyt Consultancy.
With over 15 years of experience in agency operations, Freia is an expert in the sales and pitch process, known for closing large deals.
Freia shares practical advice on:
- Developing a strong qualification process to truly understand your client’s needs
- The concept of a war room and how it helps in crafting effective strategies
- Why prioritizing financials and ROI is more important than focusing on tactics

Increase billable utilization
Improving billable utilization drives more revenue without adding more full-time or part-time employees.
With this tactic, you assign more client work and less admin work to employees. The goal is to improve their ratio of billable hours to non-billable time.
Say your team maintains an average utilization rate of 65%. If you increase that rate to 75%, you could potentially add $50,000 in revenue for a $500,000 team.
Scoro’s “Utilization” report makes it easy to monitor your team’s capacity and make the most of their billable time. Click the “Activities” filter to view either billable or non-billable work only.
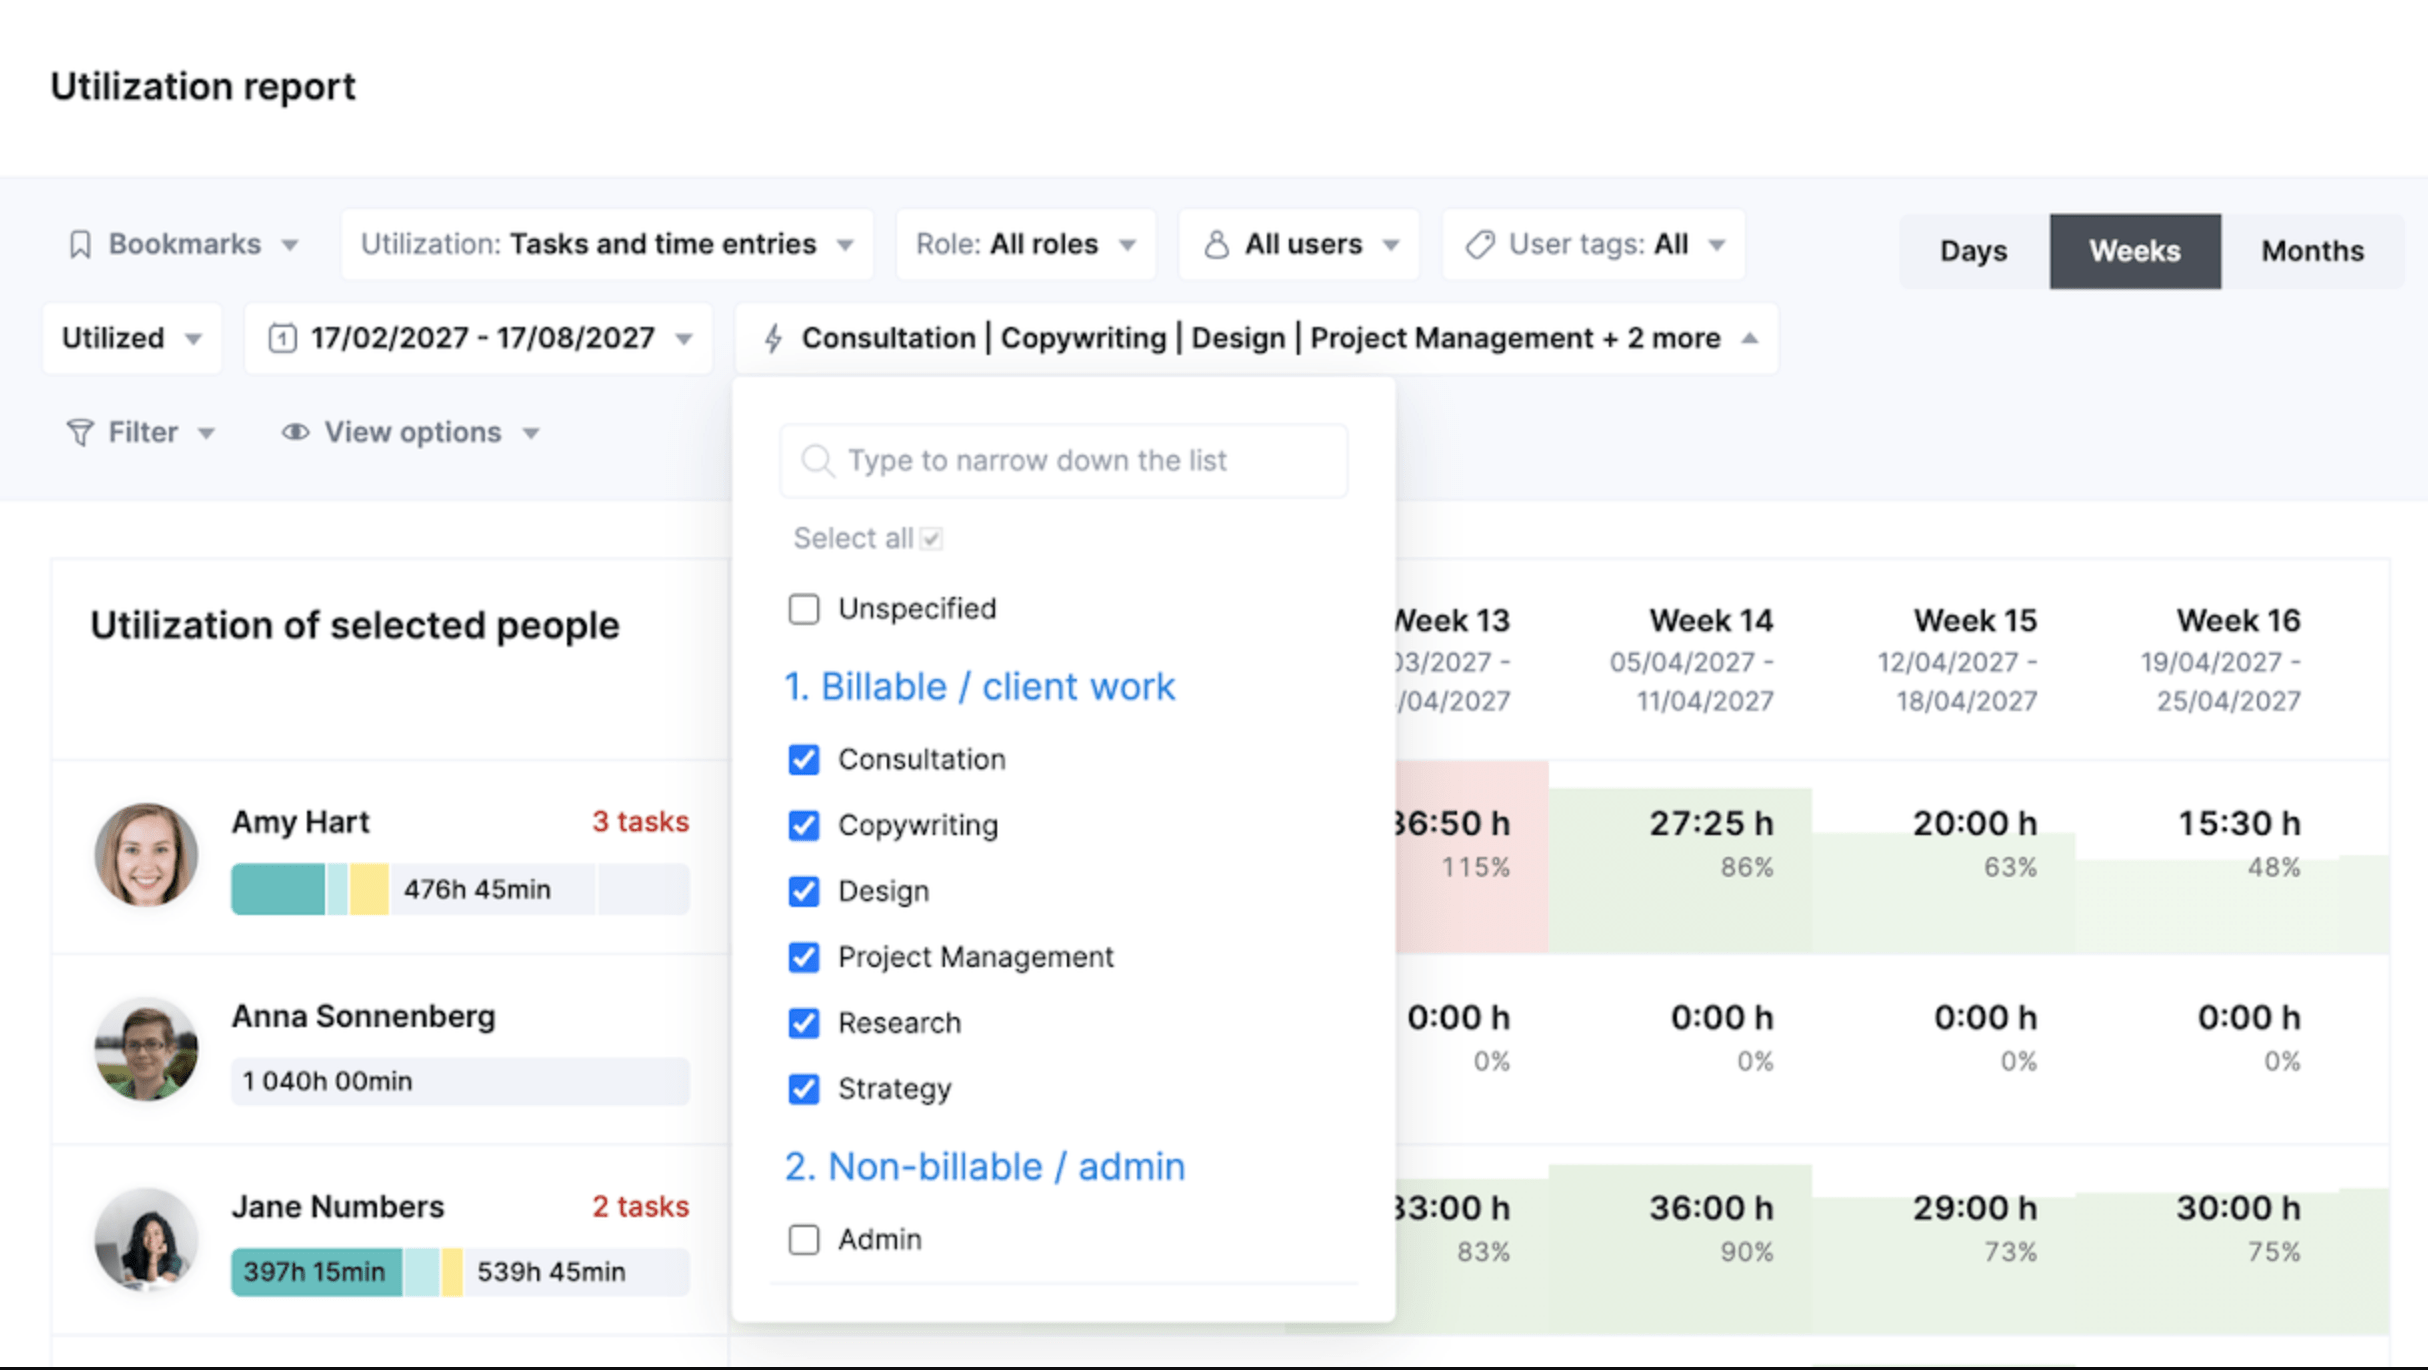
Then, review your team’s utilization. Green reflects their current hours, while white indicates available time. Red means the employee is over 100% utilization.
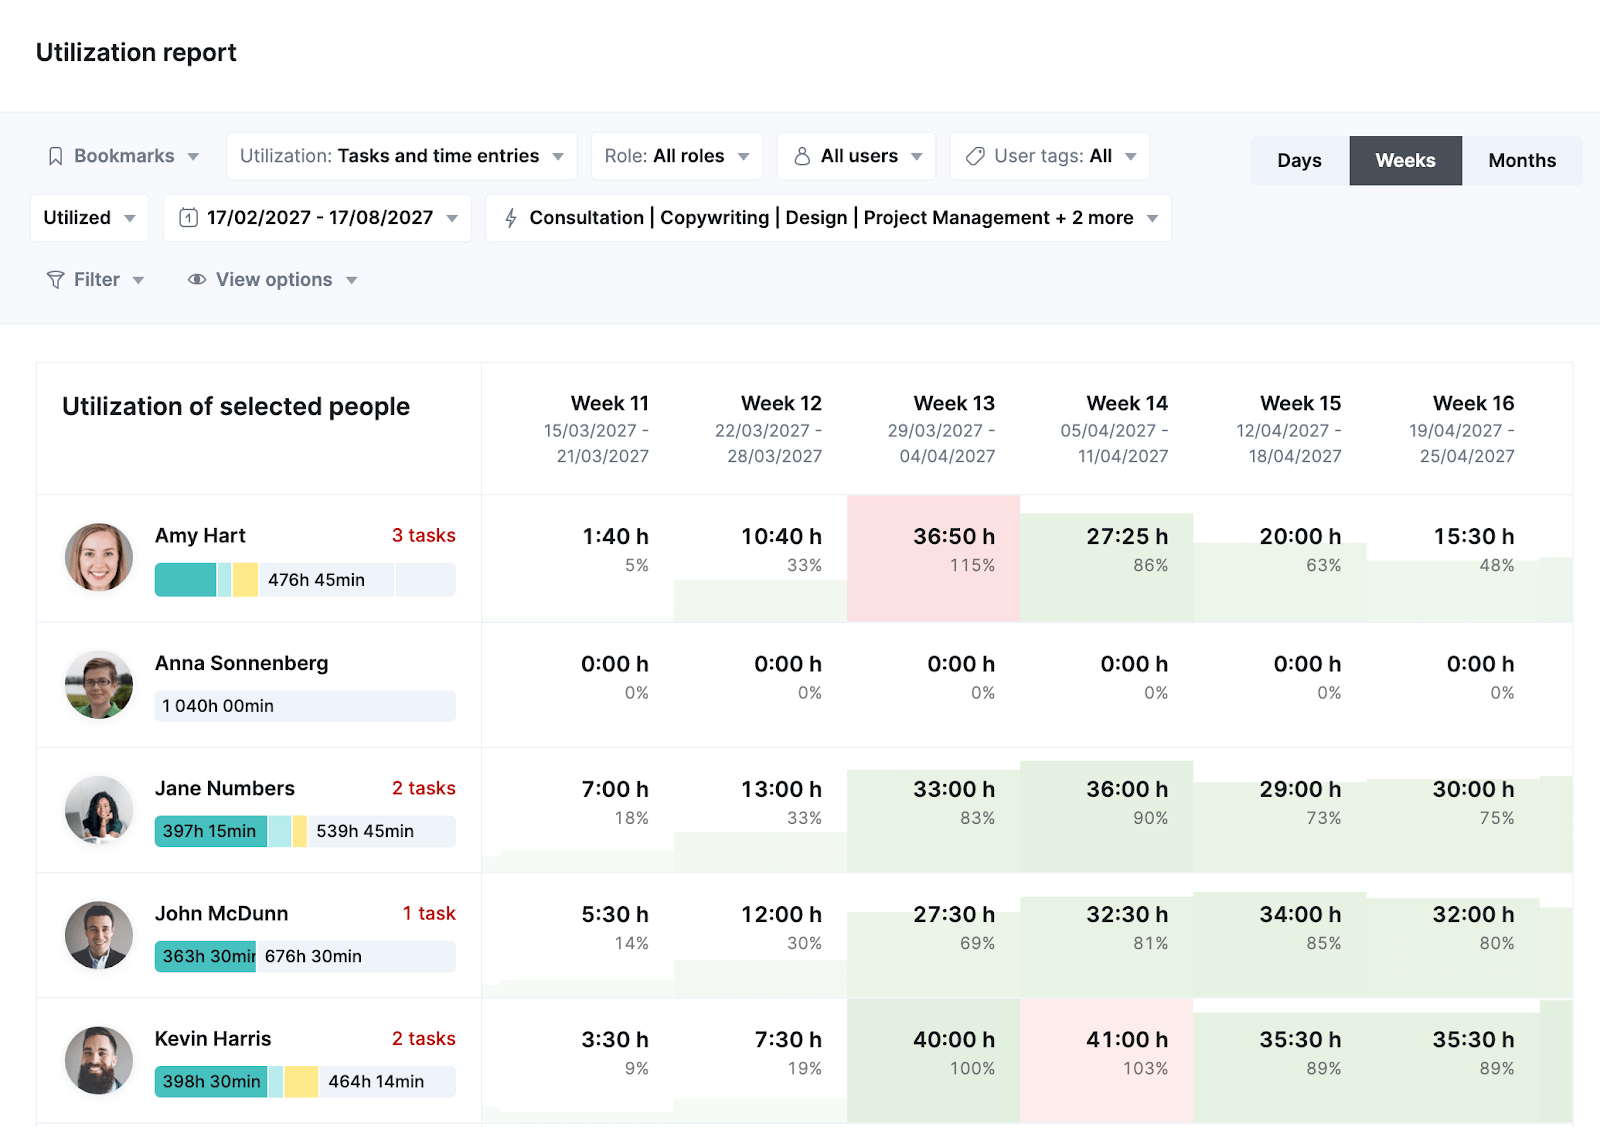
Use Scoro to rebalance workloads and reach your target utilization rate. Based on availability and expertise, reassign work from overbooked employees to underbooked team members.
If you notice too much non-billable time on employees’ calendars, start eliminating unnecessary admin tasks or meetings.
Review your tech stack
Make a list of the tools you use, their purpose, and their annual cost. Then, identify unused and overlapping tools.
You might have tools that you rarely use, or you could be paying for multiple tools with some of the same features.
In addition to costing you more money, disjointed systems often create extra admin work, which translates to more non-billable time.
Consider switching to an all-in-one platform to avoid these issues—like agency Design du Plume did. The company originally used separate tools for project management, reporting, and accounting. But this led to inaccurate data and made it hard to manage resources well.
After adopting Scoro’s all-in-one resource management software, the agency increased project profitability by 20%.
And started adjusting workloads, addressing overservicing, and making data-backed pricing updates in real-time.
Further listening
Hear from Tyler Caskey, a chartered accountant and founder of TheBeanCounters.
In this podcast episode, you’ll learn what to look for in a new tool to centralize more of the workflow and how to introduce this change to the business.
Tyler will share:
- The challenges agencies face with disjointed systems
- The importance of user-friendly and well-integrated technology
- Examples of successful consolidation

Track delivery margins
Closely monitoring delivery margins helps you price projects appropriately to cover delivery costs and maintain your profitability. These smarter pricing decisions improve RPE.
Plus, tracking delivery margins helps you spot inefficiencies like scope creep and overservicing—which lower your revenue and compromise profitability.
To monitor delivery margins, use this formula:
Delivery Margin = ((Gross Revenue – Delivery Costs) / Gross Revenue) x 100%
Say your gross revenue for a client project was $150,000. And your delivery costs for the project were $60,000. Your delivery margin would be 60% (($150,000 – $60,000) / $150,000).
Marcel recommends setting a delivery margin benchmark of 55-75% for each project to maintain healthy profitability.
Then, use Scoro’s “Project list” view to track it.
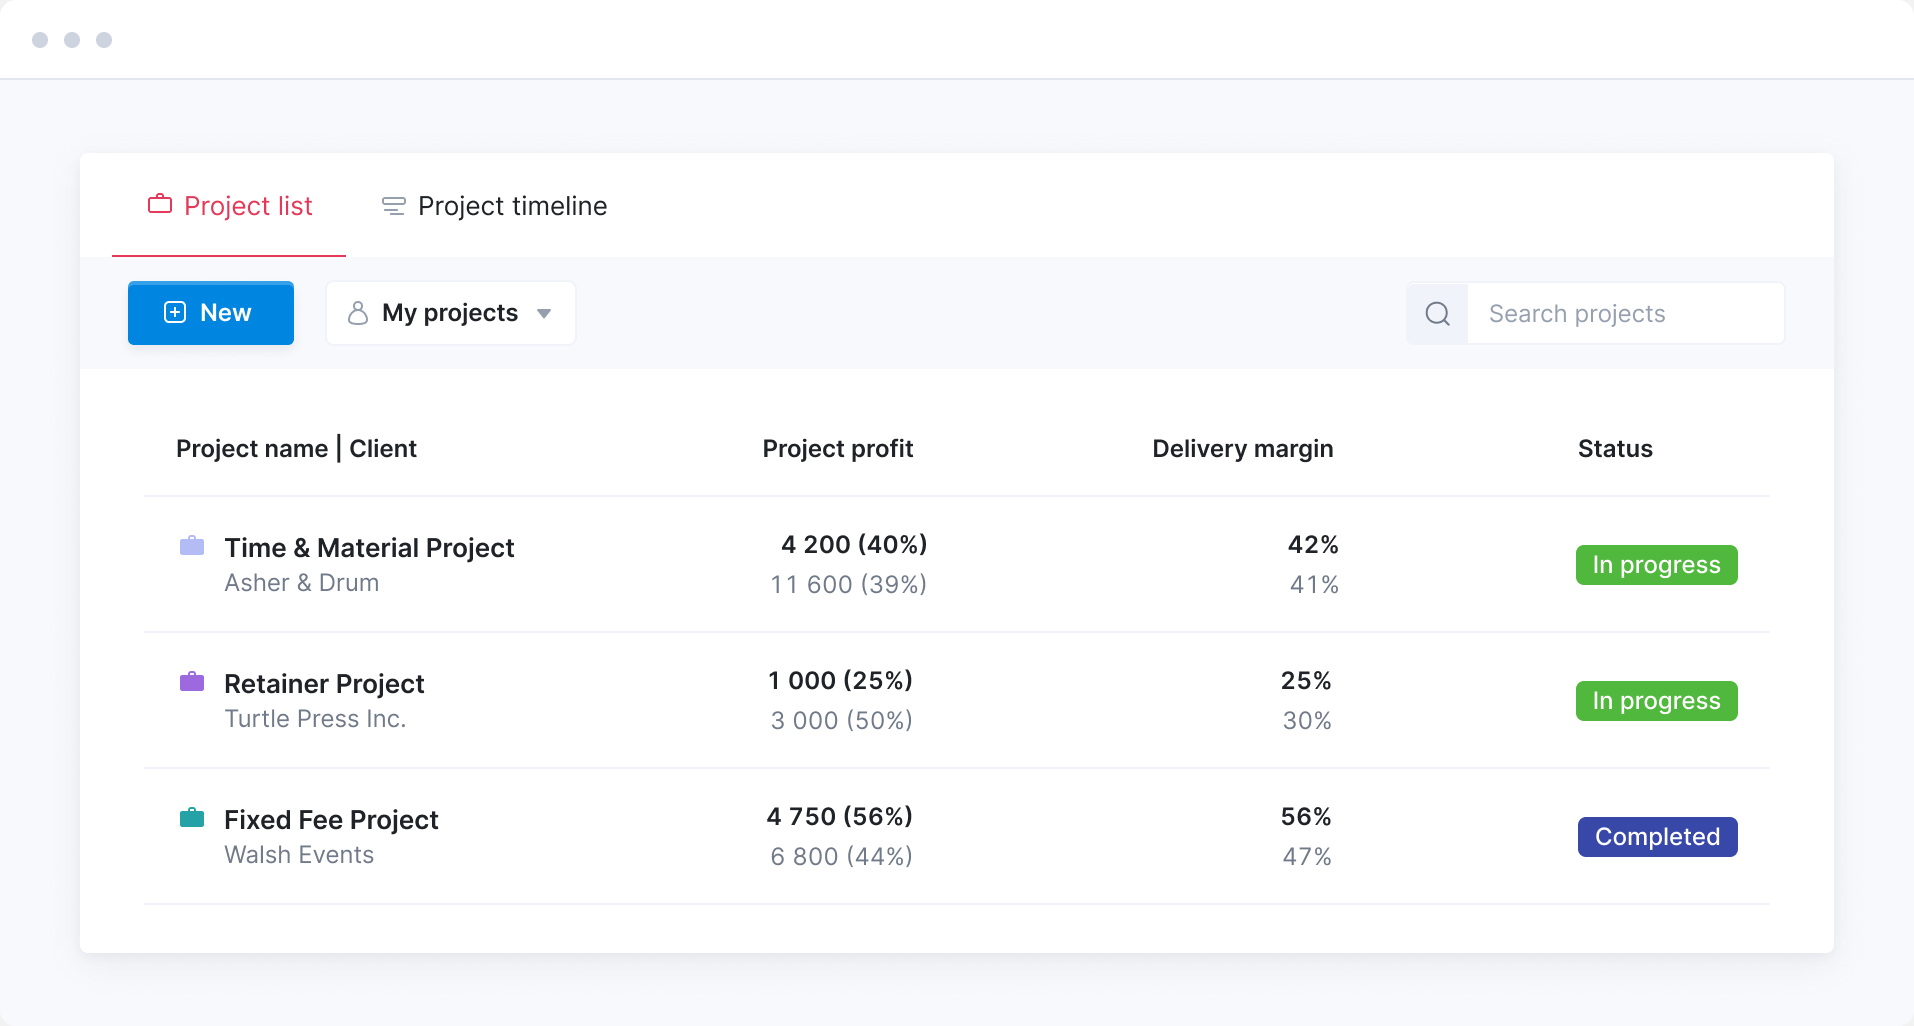
Here, you can review margins by project, client, or service.
Click the “View” button to select “Delivery margin” from the “Data columns” menu. And select “Clients” from the “Grouped by” menu.
The chart compares actual versus expected delivery margin, helping confirm that your projects successfully meet your goals. If they fall short, revisit your agency pricing model or review billable utilization to boost profitability for future projects.
Improve RPE with Scoro
When you pay greater attention to RPE, you can make the most of your team’s time and consistently reach your profitability goals.
Take global advisory firm DGA Group. By switching to Scoro, the company easily improved its RPE. Not only did they consolidate disjointed tools, but they increased project profitability by 33% and utilization by 20%.
See how Scoro can help you improve RPE and monitor margins with our free 14-day trial.