Use this utilization calculator to help you understand how effectively your employees are spending their time, both on client-facing tasks that generate revenue (billable utilization) and on all productive work (resource utilization).
Understanding billable vs. resource utilization rates
Before calculating utilization rates, we need to explain the difference between billable and resource utilization rates.
While both utilization rates measure how your employee spends their time, they focus on different aspects of productivity.
- Billable utilization focuses on the percentage of time an employee spends on tasks that can be billed to clients or directly generate revenue. It’s a crucial metric for service-based businesses and project-oriented teams.
- Resource utilization encompasses all the time an employee spends on productive work, whether it’s billable to clients or not. This includes internal projects, training, administrative tasks, etc.
So, why should you care about both?
Billable utilization is your money meter. It shows how much of your team’s effort translates into revenue. This is essential for gauging project profitability and spotting areas where you can improve your margins.
Resource utilization is your efficiency compass. It helps you spot hidden areas of optimization—maybe an employee is spending too much time on admin tasks, or perhaps there’s a training opportunity that could increase their billable hours.
By tracking both, you can get the full story of your workforce’s productivity, from top-line revenue to the nitty-gritty of daily tasks.
Utilization Rate Calculator
Here's a breakdown of how this utilization calculator works:
Inputs:
- Available Capacity: The expected total working hours for that employee in the same timeframe (e.g., 40/week, 160/month).
- Total Hours Worked: The actual number of hours the employee worked during the chosen time period (weekly or monthly).
- Total Billable hours: Hours spent on tasks directly linked to client billing or revenue generation.
Outputs:
- Billable Utilization %: The percentage of available time dedicated to billable work. This is crucial for understanding revenue generation.
- Resource Utilization rate %: The percentage of available time spent on any productive work, billable or not. This includes meetings, training, and other essential tasks.
Let's run through a couple of examples.
Example 1: Jane
Jane worked 38 hours last week, with 30 of those hours being billable. Her standard workweek is 40 hours.
- Billable utilization rate: (30 hours / 40 hours) * 100 = 75%
- Resource utilization rate: (38 hours / 40 hours) * 100 = 95%
This means Jane spent 75% of her time on revenue-generating work and 95% of her time on productive work overall.
Example 2: Team Utilization
You have a team of 3 employees:
- Employee A: 40 hours worked (32 billable)
- Employee B: 35 hours worked (25 billable)
- Employee C: 45 hours worked (40 billable)
To calculate team utilization:
- Total hours worked: 120 hours
- Total billable hours Worked: 97 hours
- Total available capacity: 120 hours (assuming each employee has a 40-hour workweek)
Which gives you:
- Team resource utilization rate: (120 hours / 120 hours) * 100 = 100%
- Team billable utilization rate: (97 hours / 120 hours) * 100 = 80.8%
Utilization benchmarks
A high resource utilization rate (above 90%) indicates that employees are actively engaged in productive work, whether billable or not. This can be a positive sign of a busy and efficient team.
However, consistently exceeding 95% might lead to burnout and reduced work quality.
On the other hand, the ideal billable utilization rate varies depending on the specific role and industry.
For example, "producers" such as consultants, designers, and developers primarily focusing on client-facing work should typically aim for high billable utilization to maximize revenue.
In contrast, managers, sales professionals, and support staff often have lower billable utilization due to the nature of their work.
| Role | Focus | Target |
|---|---|---|
| Producers | Focused on client work and delivery | 75%-80% |
| Managers | Focused on managing delivery and clients | 35%-50% |
| Sales team and admin | Focused on pipeline and business management | >10% |
Tracking utilization metrics with Scoro
Understanding and improving billable utilization, especially for client-facing roles, can dramatically increase your company's profitability.
You can track both billable and resource utilization using a work management platform like Scoro.
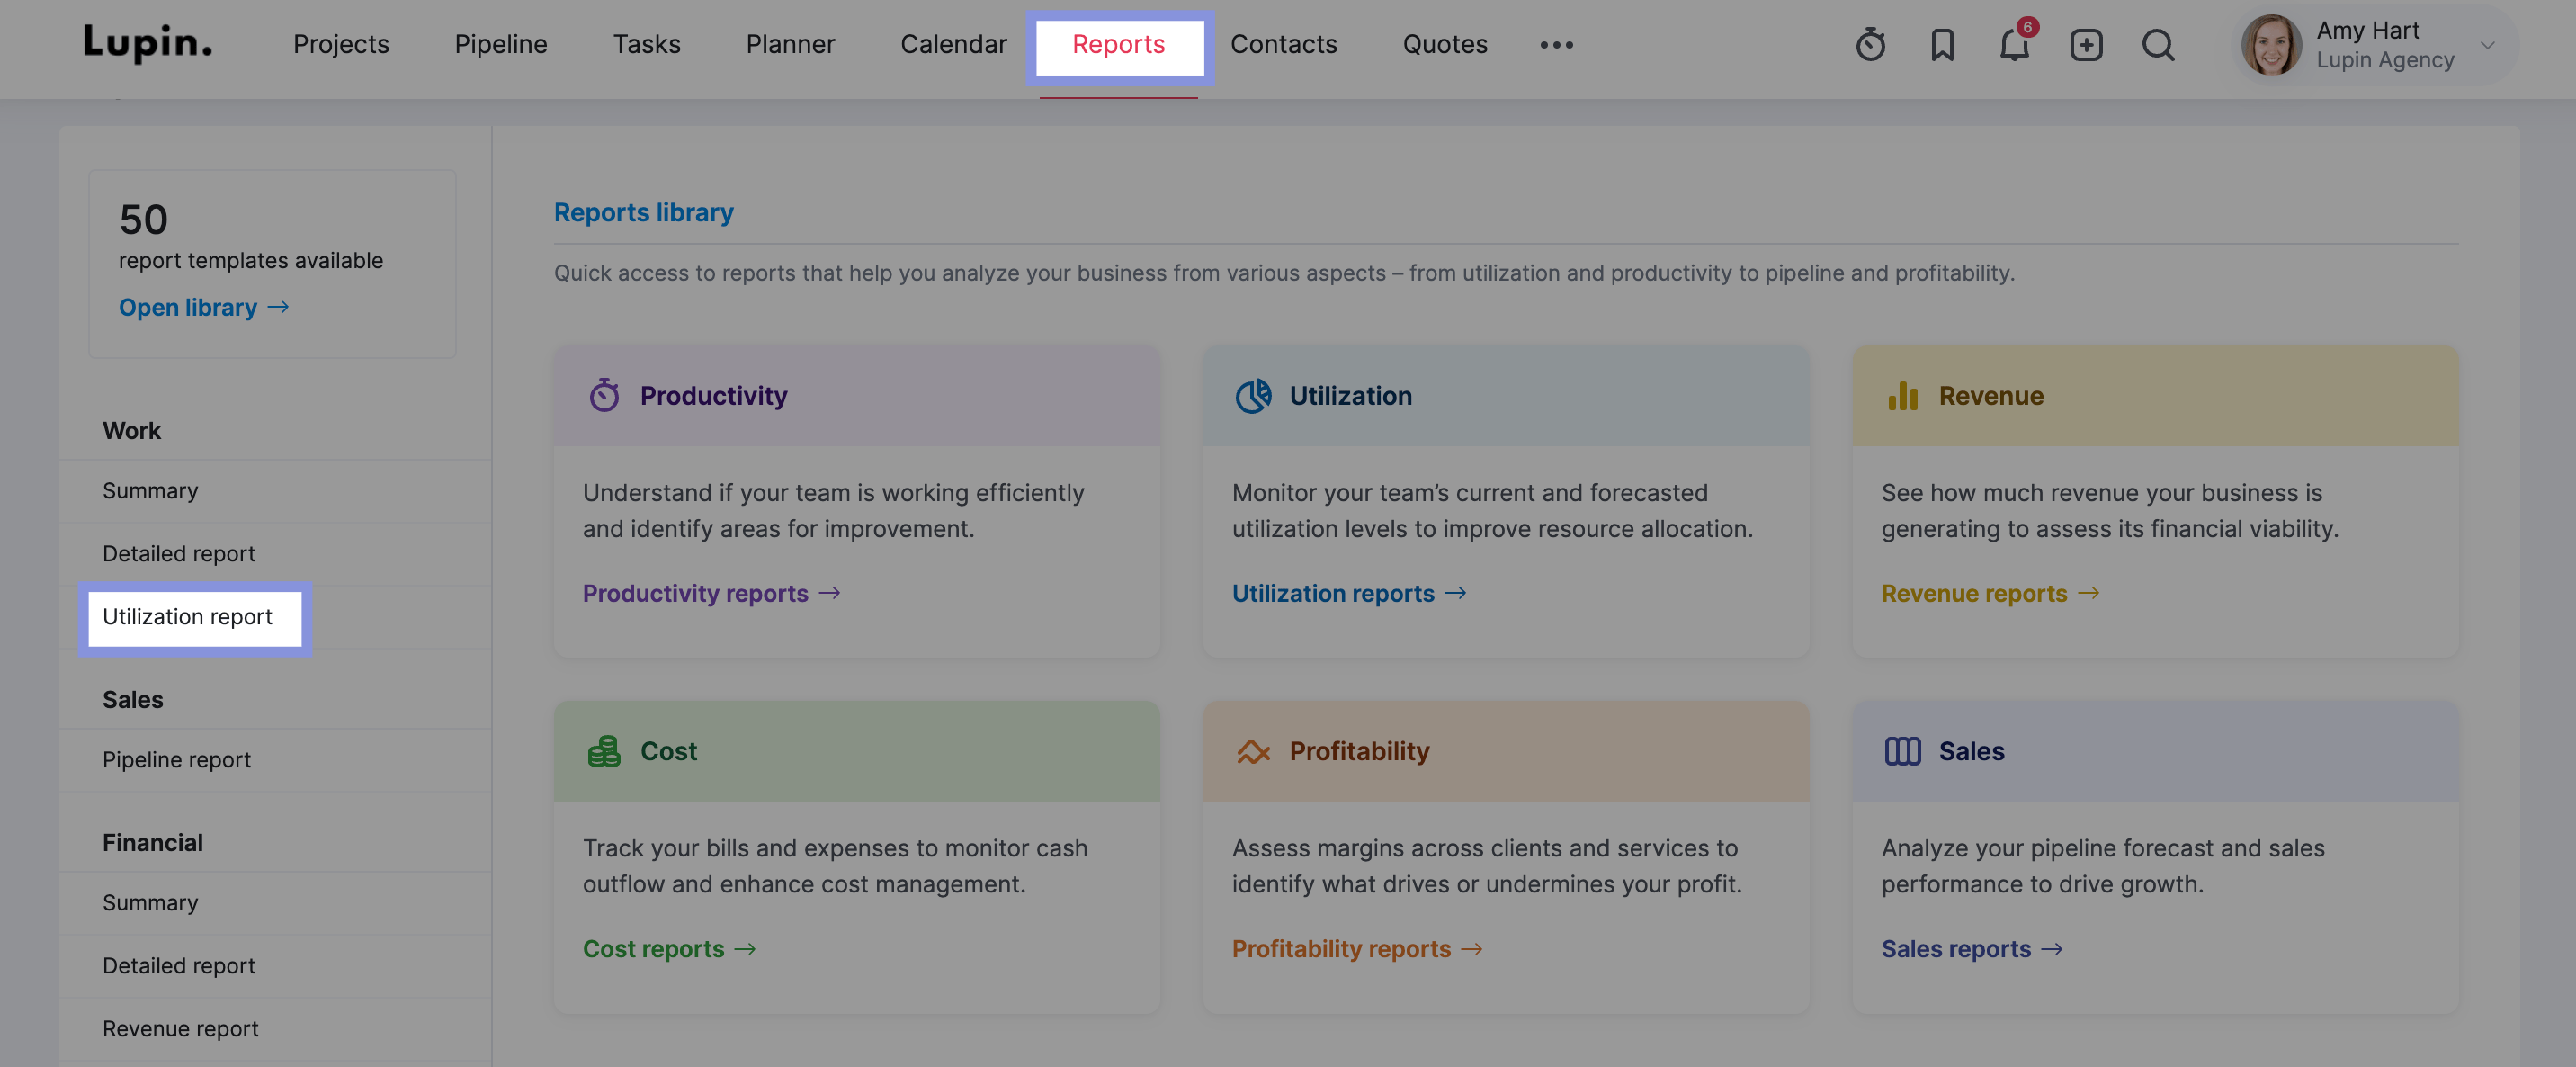
Scoro's “Utilization report" makes it easy to analyze your team's time usage.
To find the report, navigate to the "Reports" module and select "Utilization report."

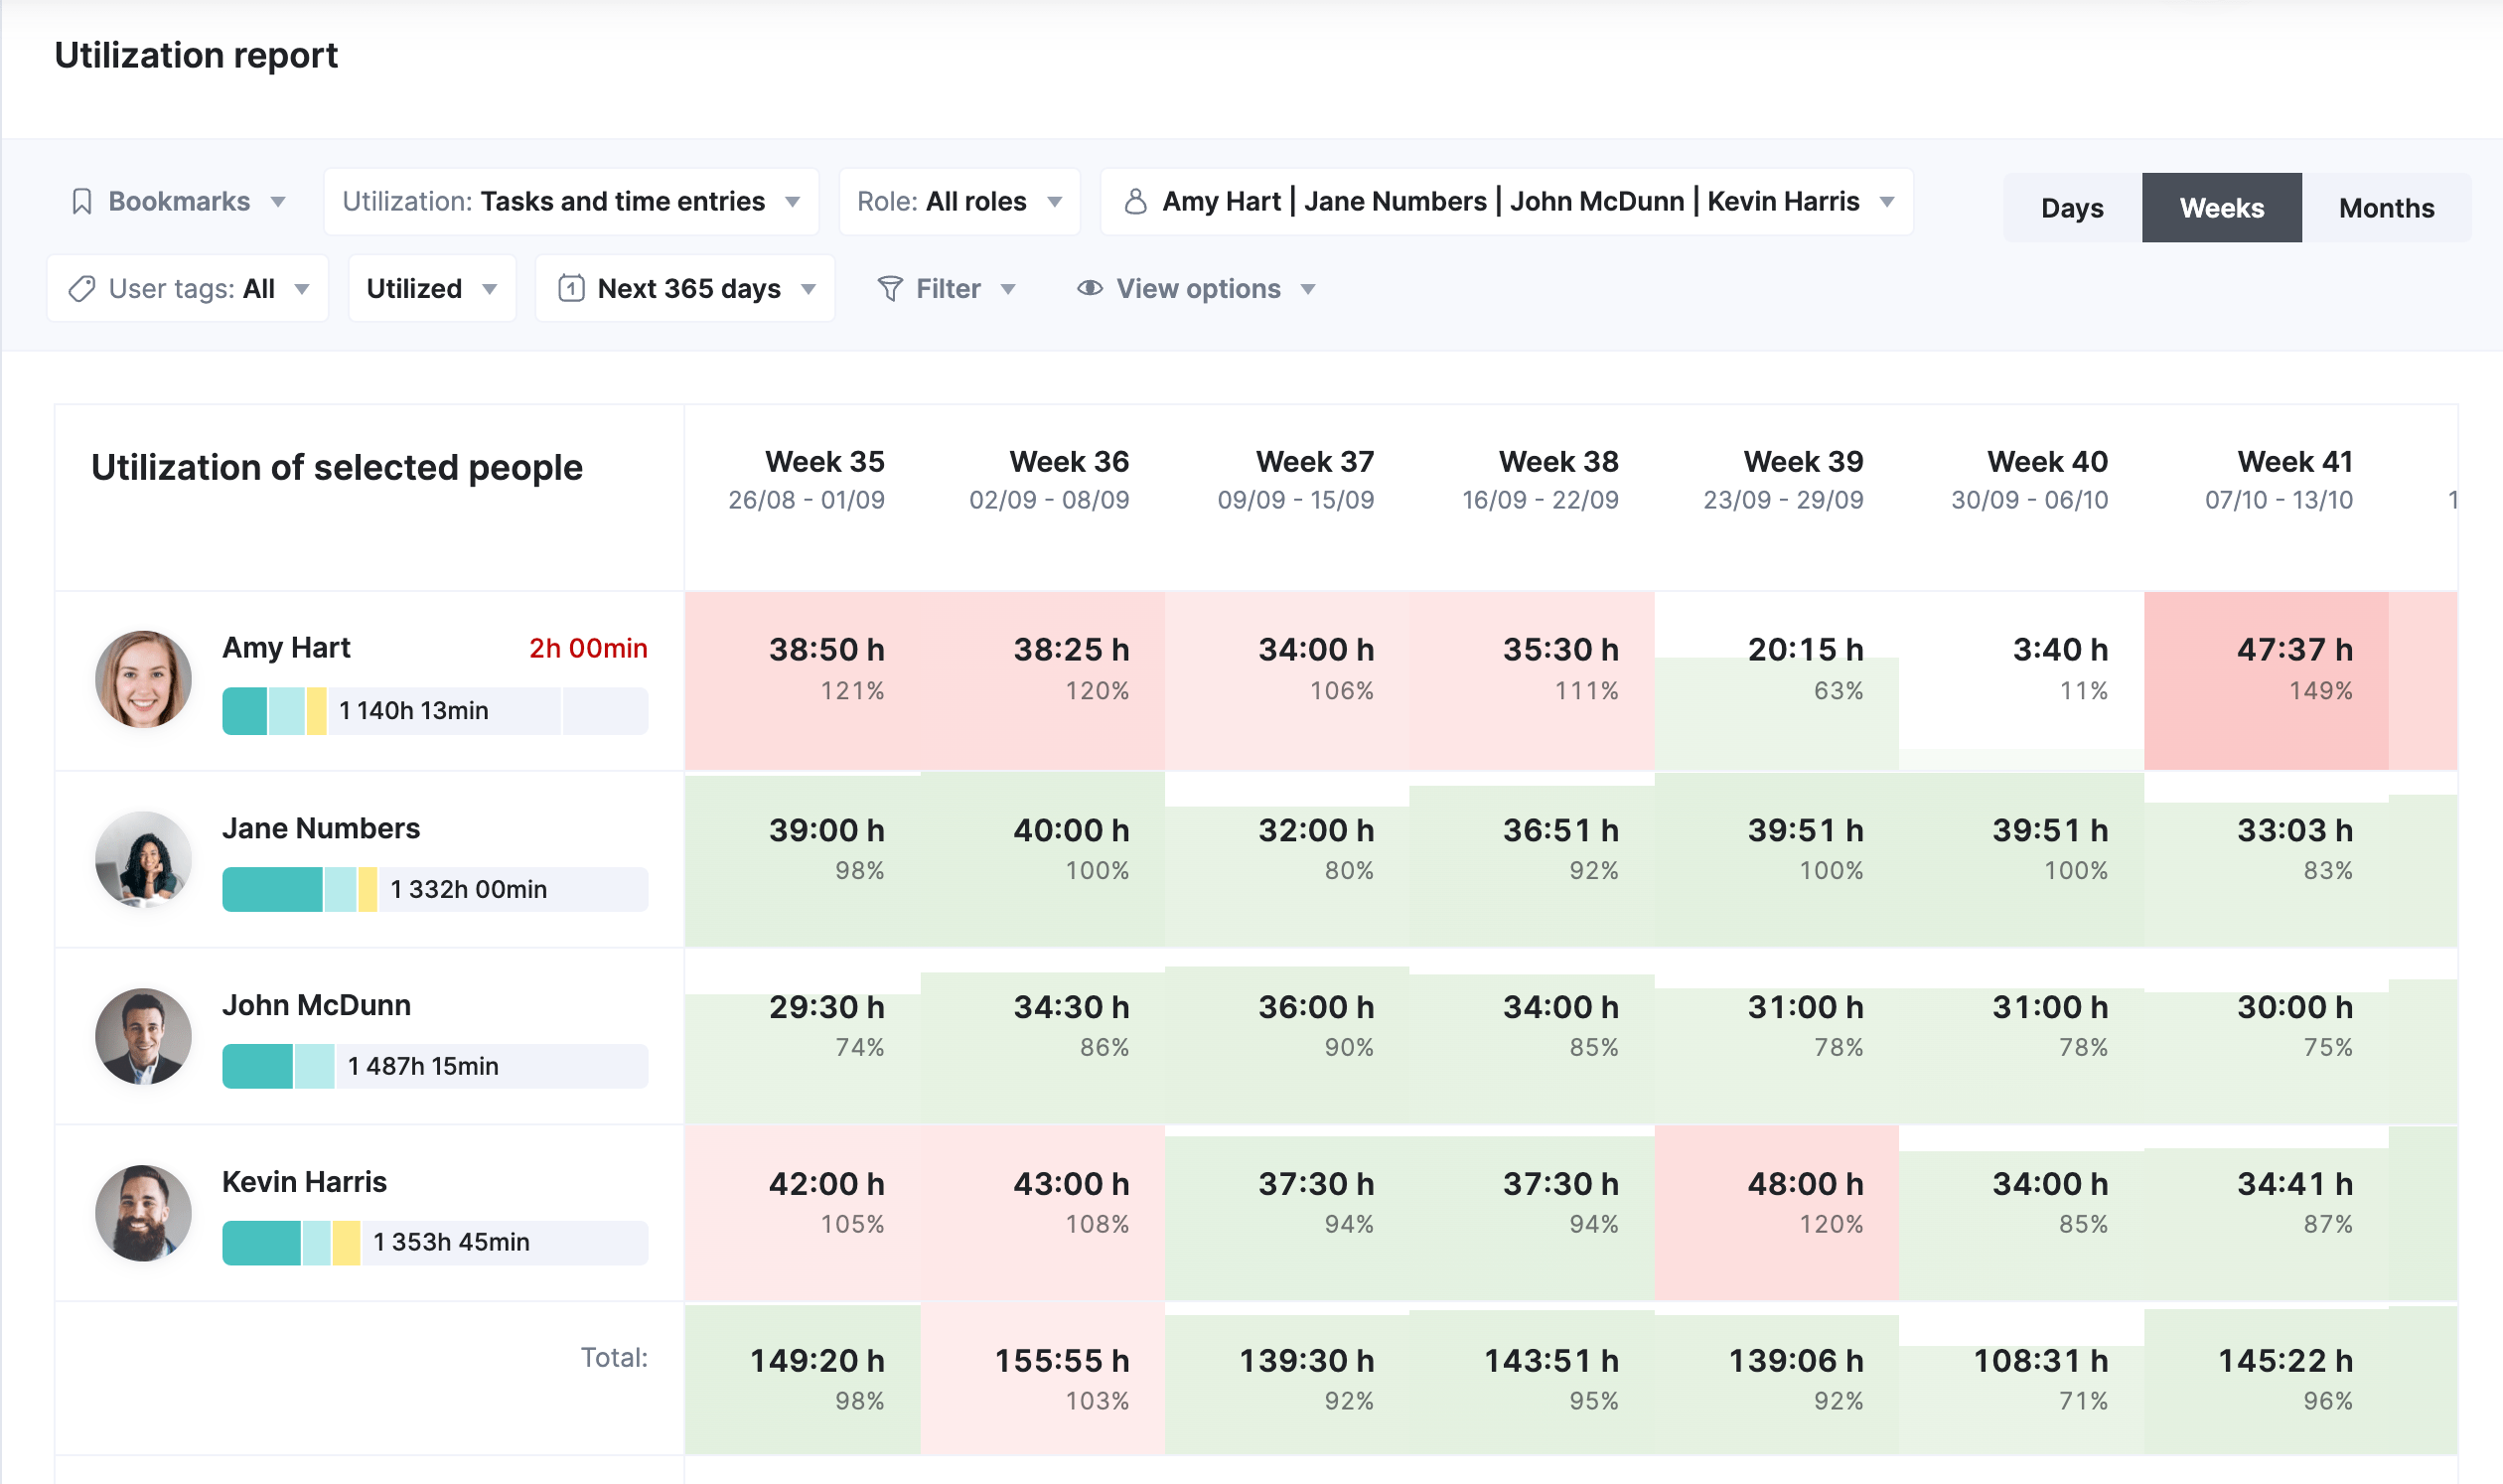
And here's an example of what the "Utilization report" may look like once you get your team to start tracking their time.

How the "Utilization report" works:
- Time tracking: Employees track time on tasks, categorizing them as billable or non-billable.
- Data aggregation: Scoro collects this time data and calculates utilization rates based on the individual's available hours.
- Report generation: The report displays this data in an easy-to-understand format, including heatmaps and detailed breakdowns of where the time is being spent
- Data filtering: The report defaults to showing resource utilization (all work). However, you can easily filter to view billable utilization (client-related work only)
- Analysis: The report can be used to identify underutilized or overworked employees, adjust workloads, and improve overall resource allocation
We’ve detailed the process of creating a utilization report you can analyze in our "Employee Resource Utilization 101: Your Ultimate Guide."
Check out our other guides to learn more about utilization metrics and reports:
- Billable Utilization 101: Your Ultimate Guide
- Employee Resource Utilization 101: Your Ultimate Guide
Or sign up for a free Scoro trial and start tracking your employee's utilization today.


