
What is a utilization report?
A utilization report tells you how your employees are spending their work time. It shows how much time they spend on tasks, projects, and other activities, differentiating between billable (revenue-generating) and non-billable (internal, administrative) work.
Utilization reports help calculate key metrics like:
- Billable utilization rate: The percentage of total working hours spent on billable activities, indicating how effectively a team generates revenue.
- Resource utilization rate: The percentage of total working hours spent on all activities (billable and non-billable), revealing a team or individual’s overall capacity and workload.
Let’s say you have a designer on your team who works eight hours daily. If they spend six hours on billable client projects and 1 hour in internal meetings, their daily billable utilization rate would be 75% (6 / 8 x 100).
However, their resource utilization rate (which accounts for both billable and non-billable work) would be 87.5% ((6 + 1) / 8 x 100)
Here’s an example of what a basic utilization report might look like for an eight-hour working day, building on our designer example:
| Day | Billable Hours | Non-Billable Hours | Billable Utilization | Resource Utilization |
|---|---|---|---|---|
| Monday | 6 | 1 | 75% | 87.5% |
| Tuesday | 5 | 3 | 62.5% | 100% |
| Wednesday | 4 | 1 | 50% | 62.5% |
| Thursday | 7 | 0.5 | 87.50% | 93.75% |
| Friday | 6.5 | 2 | 81.25% | 106.25% |
Different types of utilization reports
There are two main types of resource utilization reports: employee utilization and role-based utilization.
Employee resource utilization report
An employee utilization report focuses on individual employees’ work patterns. It reveals how much of their time is spent on tasks, projects, and other activities, categorized as billable or non-billable.
An employee utilization report provides many valuable insights. It can help you to:
- See who is overworked and take action to support them, like rebalancing workloads
- Spot who is available to take on more work so you can take on new projects and optimize resource allocation
- Track employee productivity and efficiency, which can inform performance evaluations, training needs, and workload adjustments
- Forecast capacity, so you can plan how much work your team can take on before committing to projects
- Support invoicing and billing processes by tracking billable hours for clients and projects
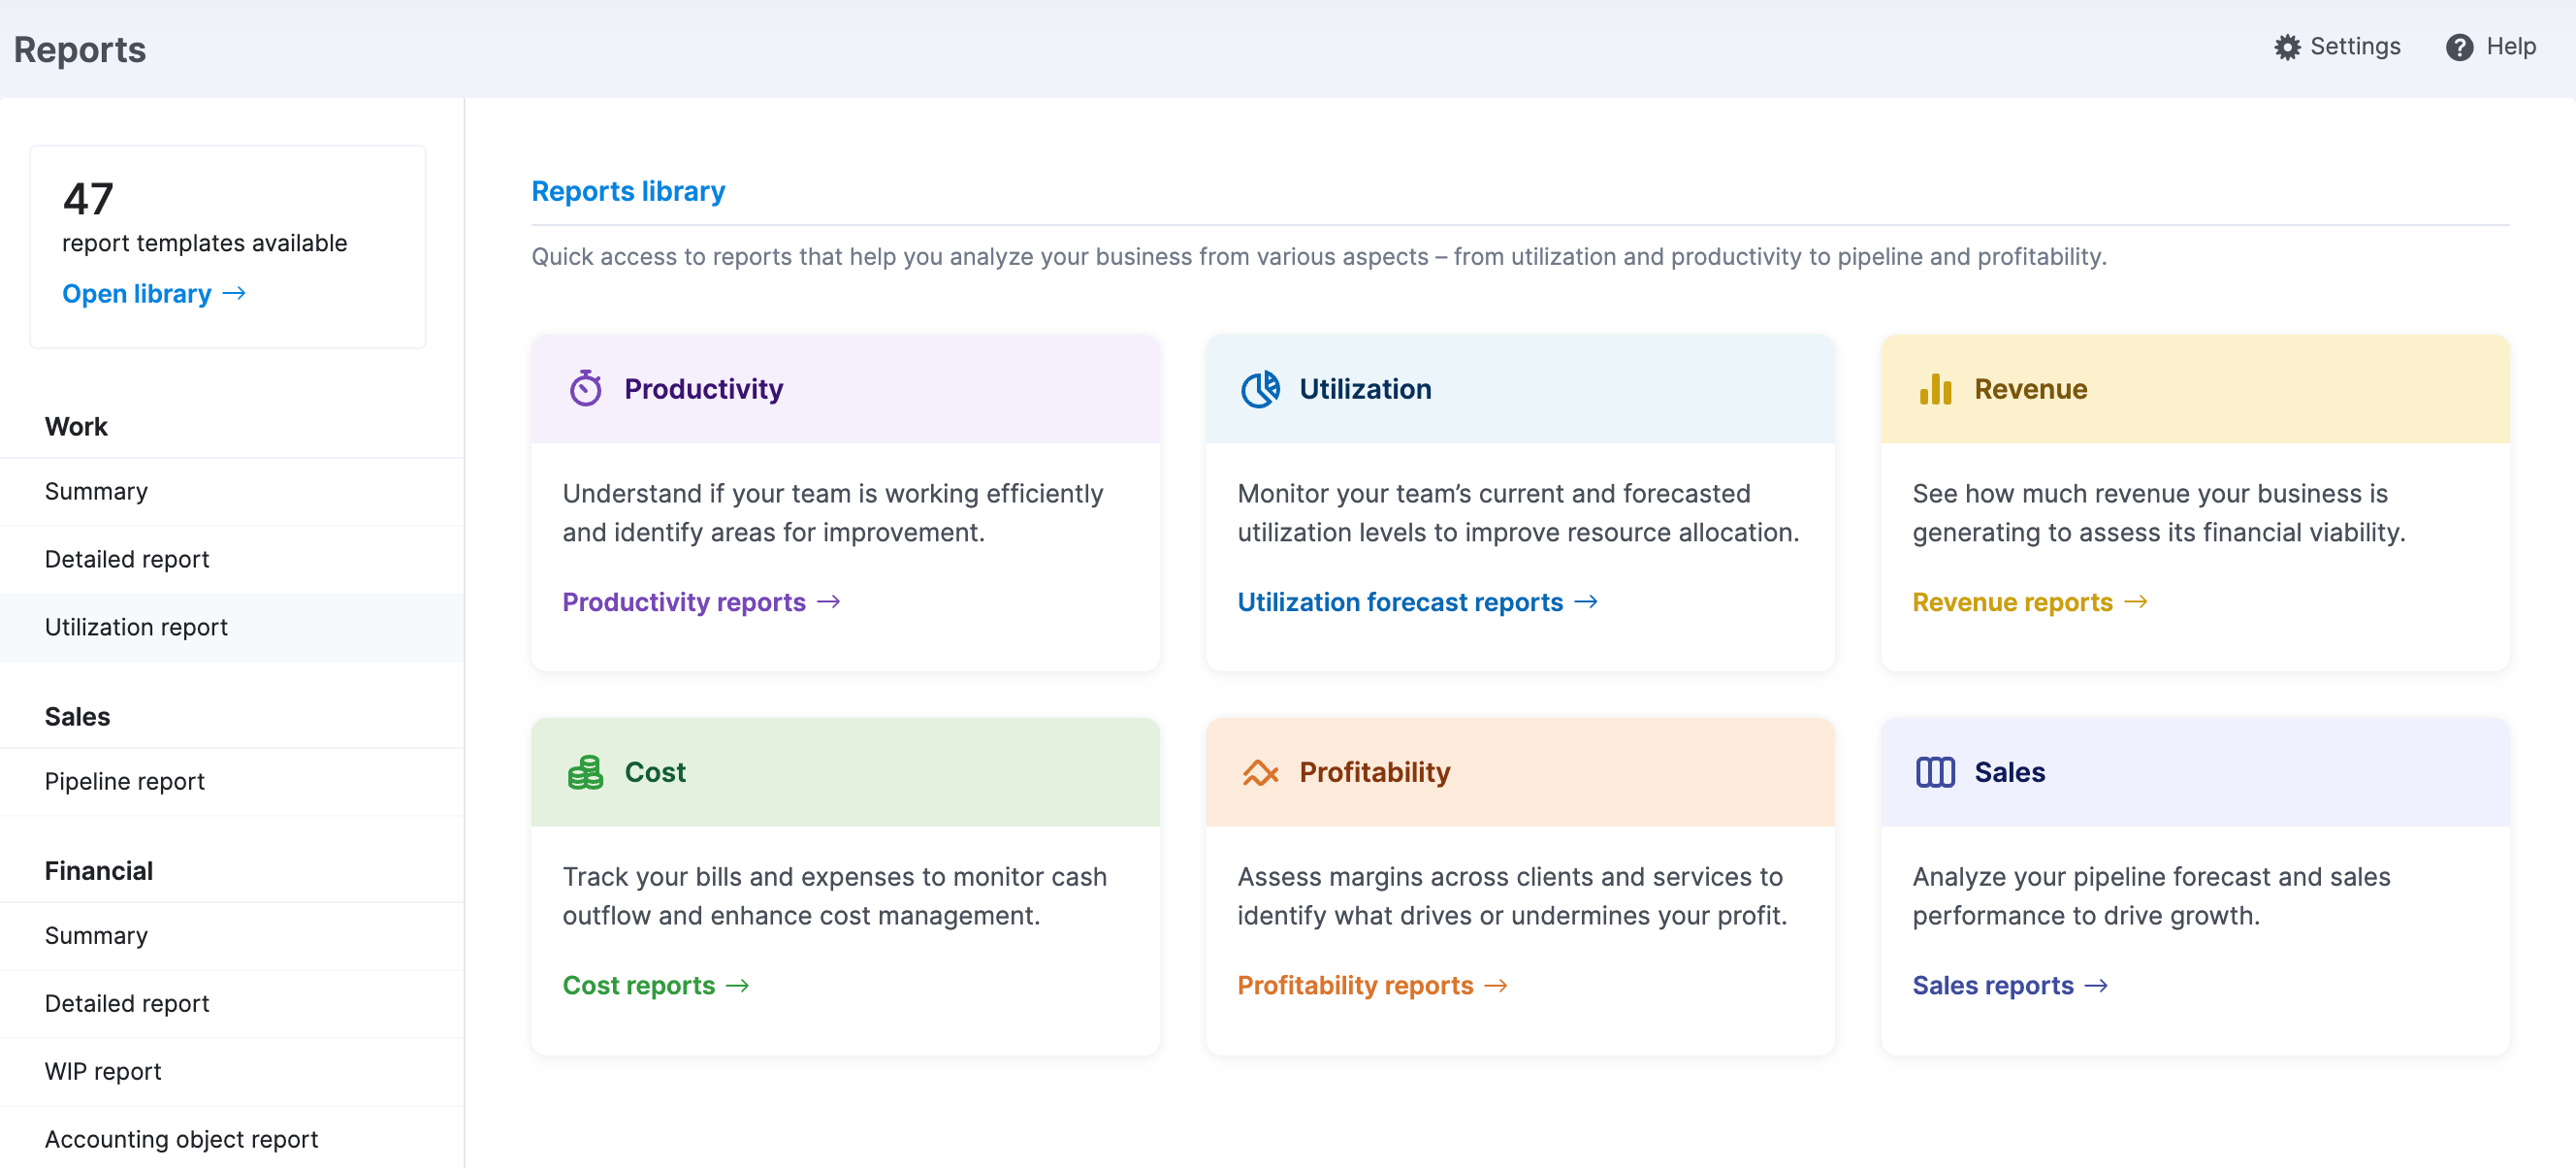
Using a professional services project management tool like Scoro, you can monitor your employee’s utilization.
To access the report, click the “Reports” module. Within the “Reports” module, you’ll find a list of various reports. Select the “Utilization report” option.
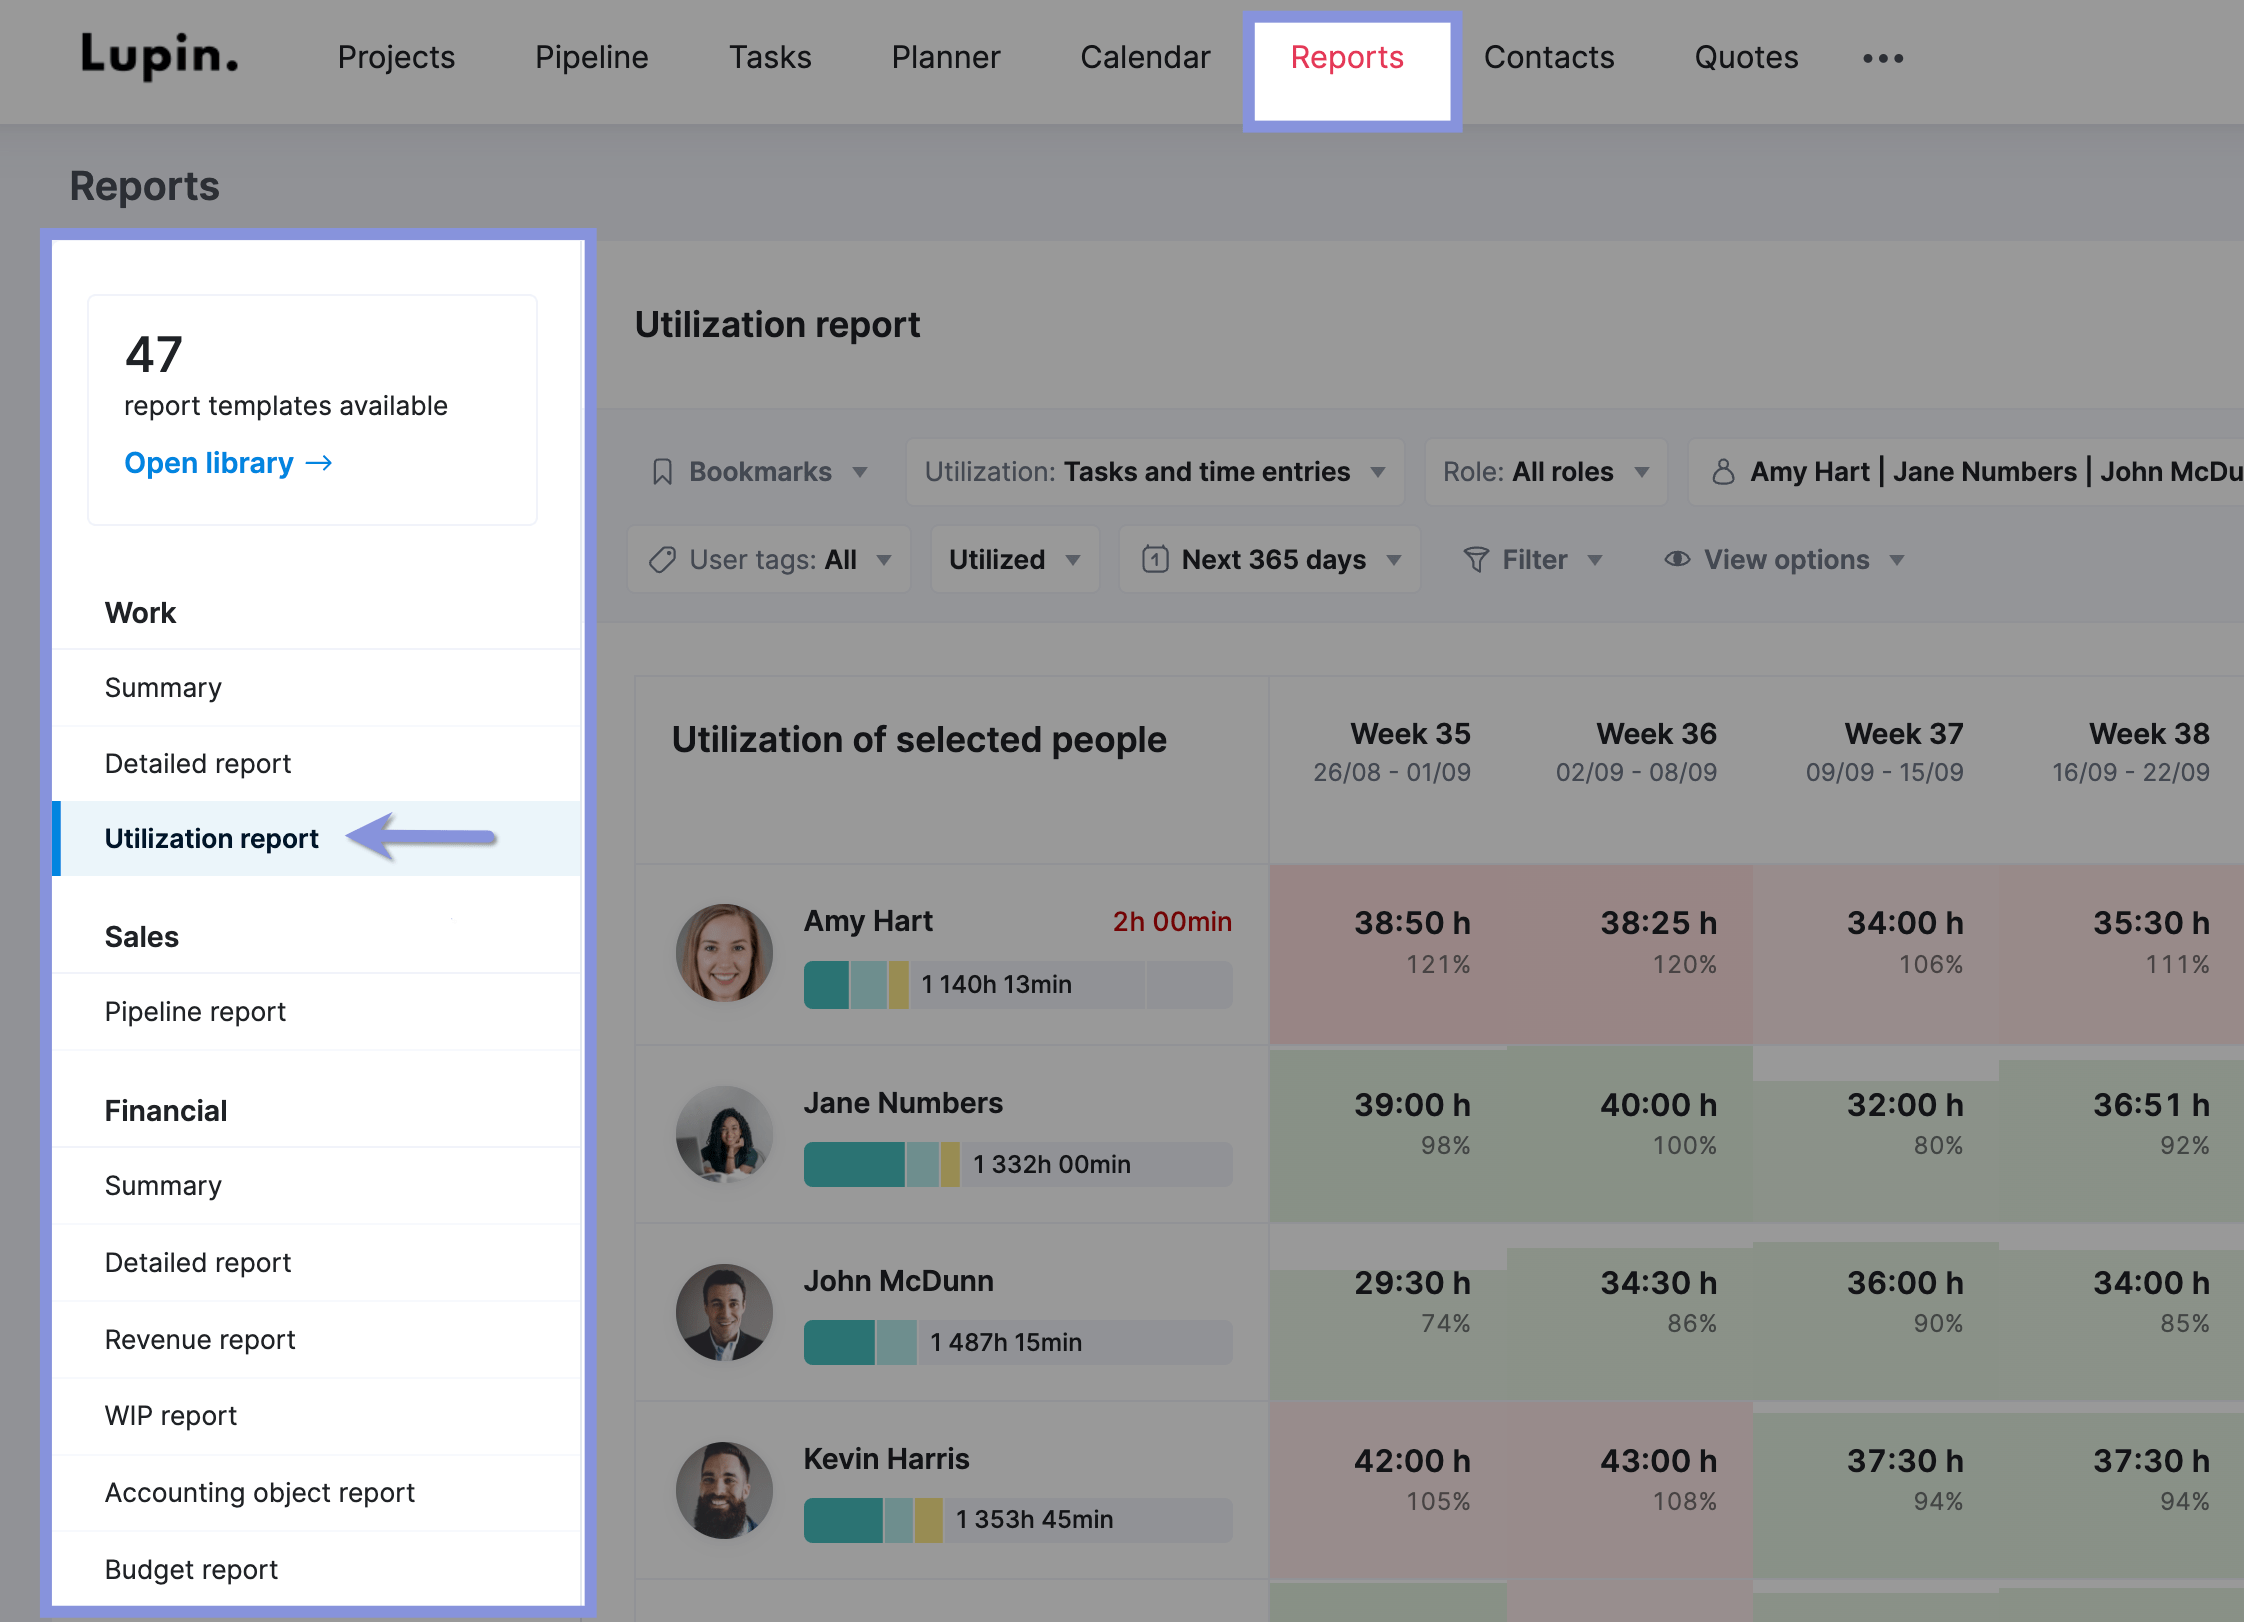
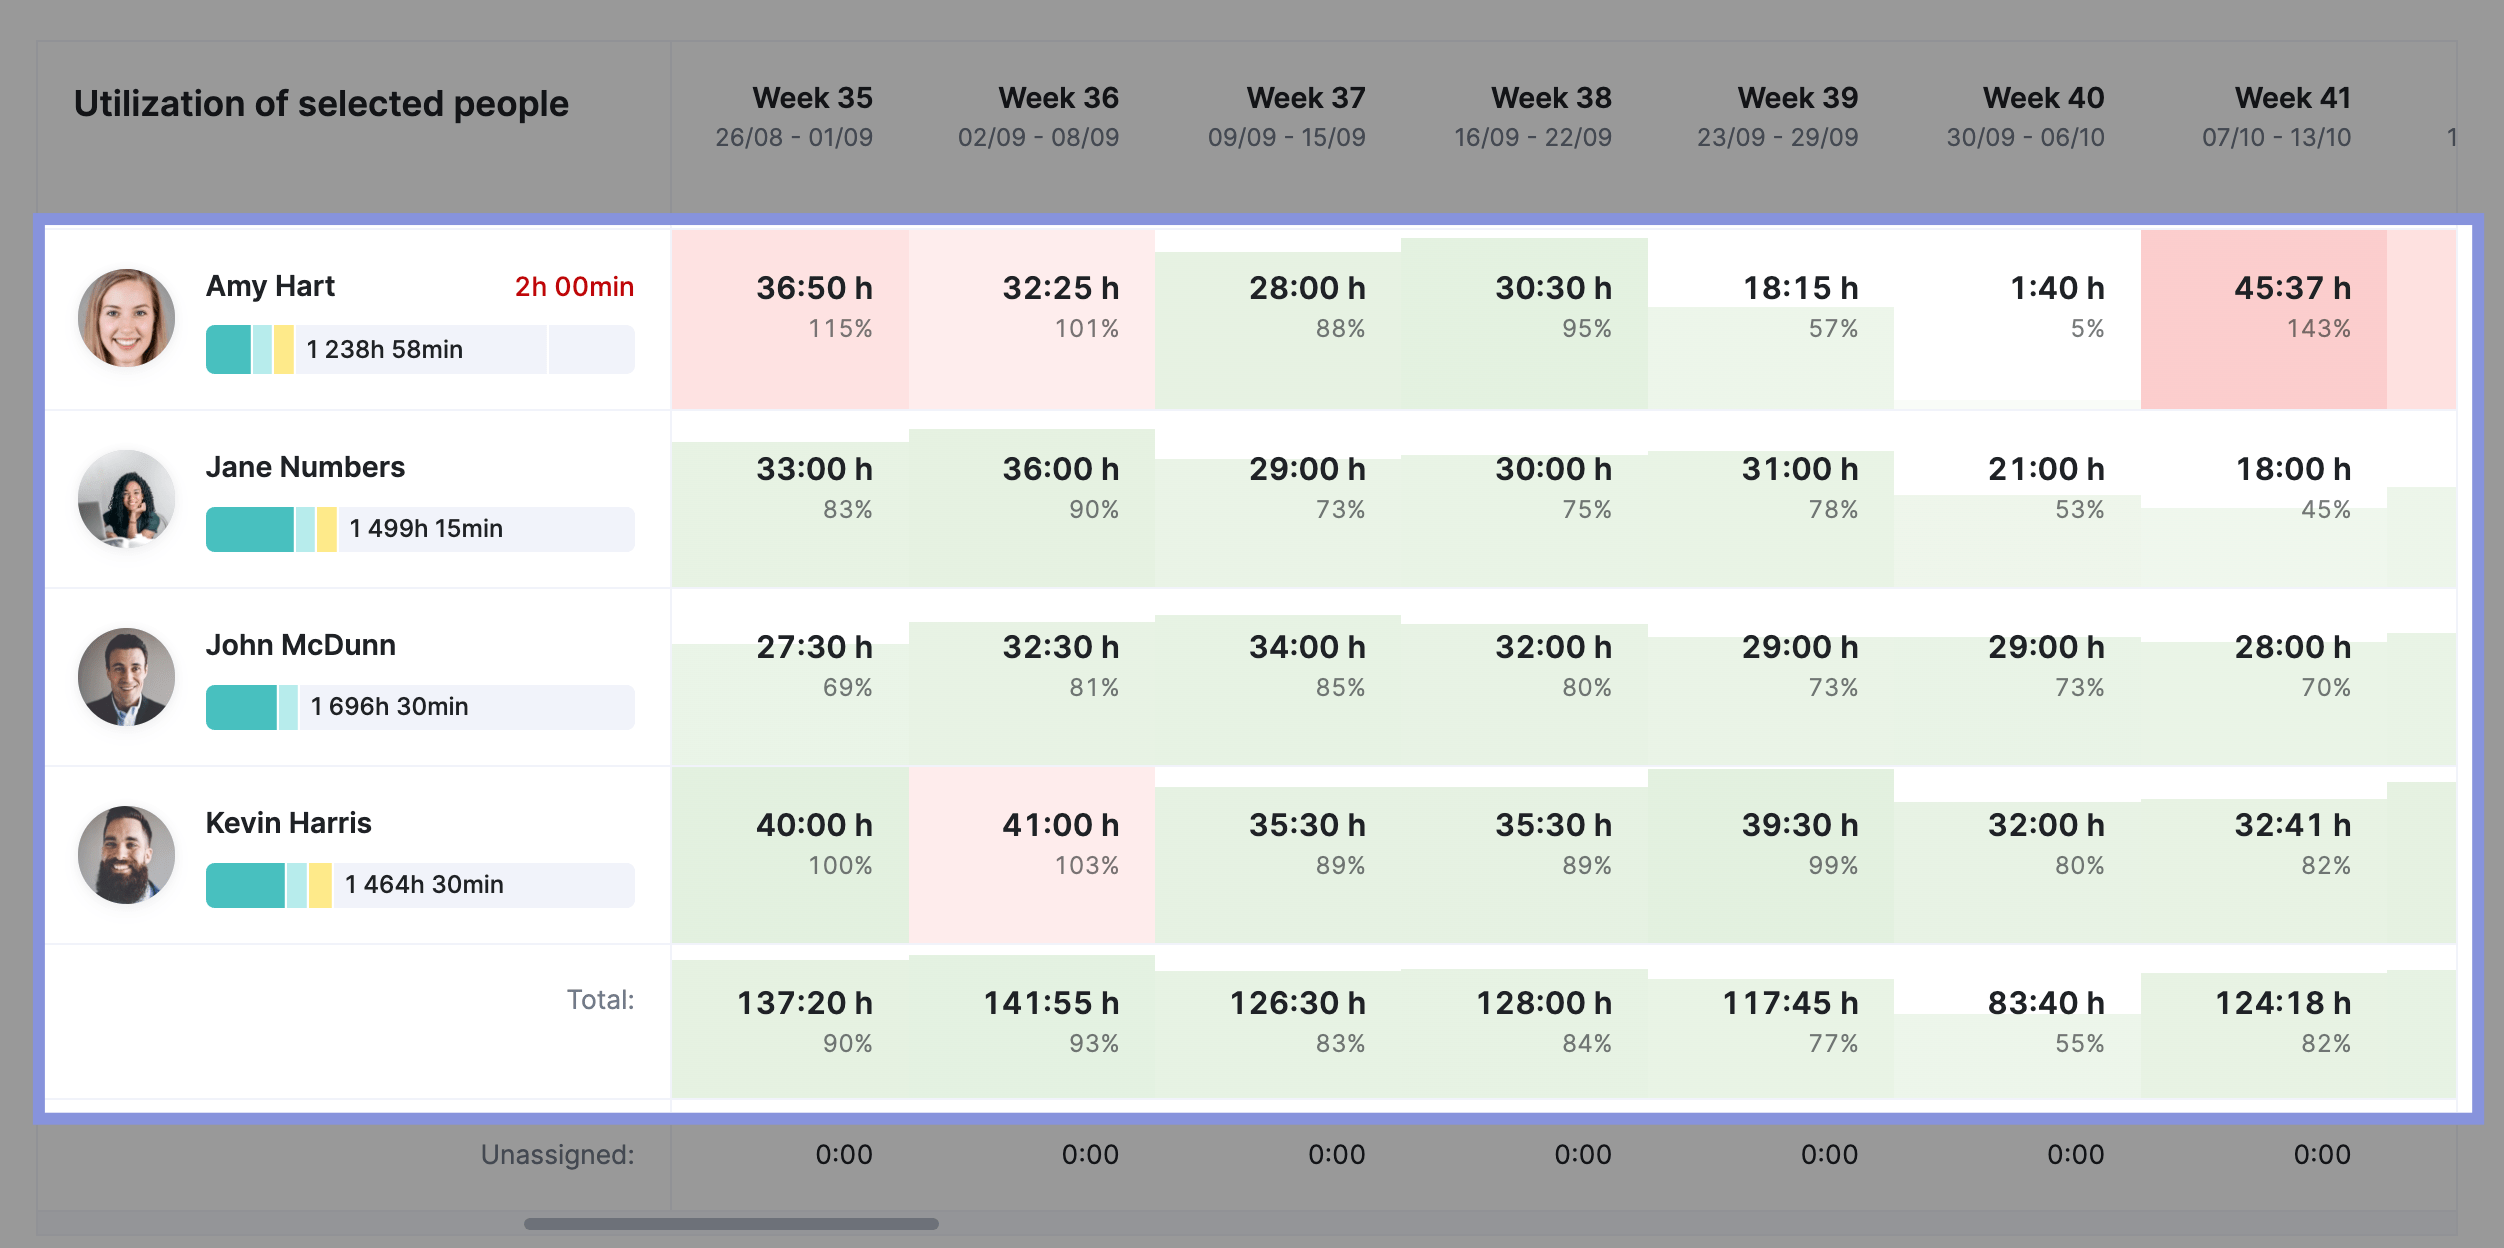
The report includes the following information:
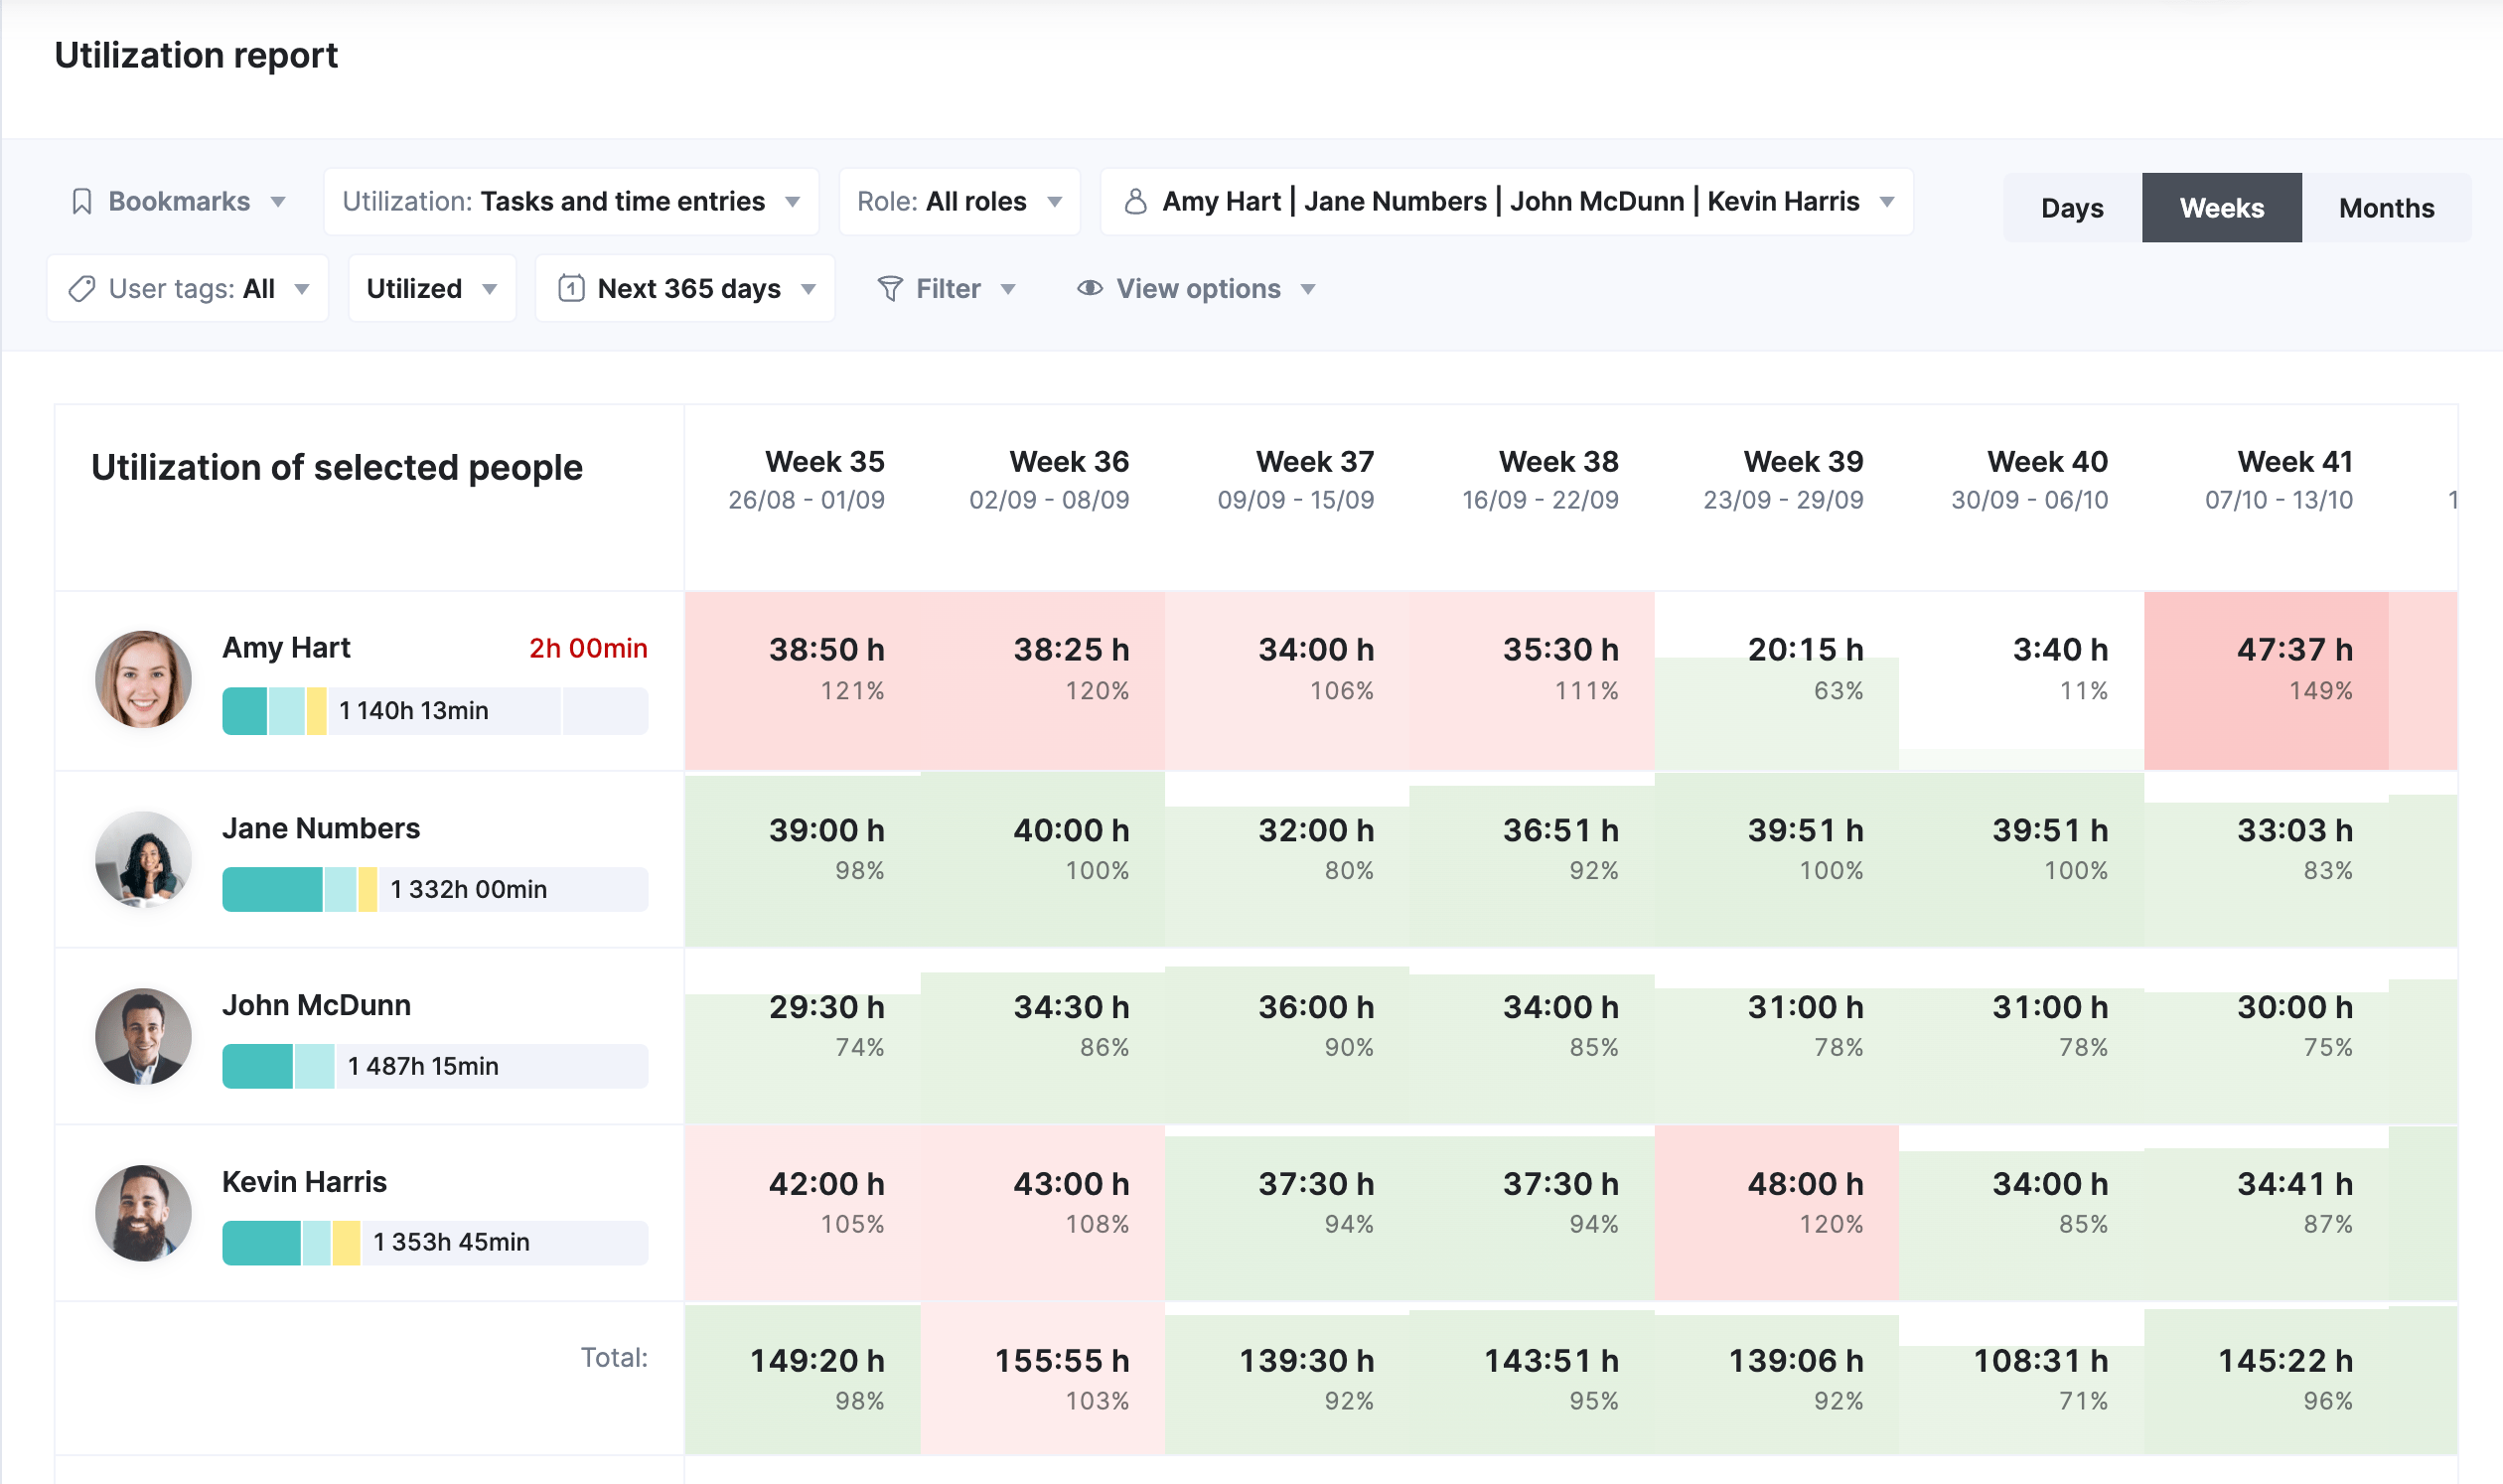
- Utilization of selected people: Displays the total hours each team member has worked, broken down into categories such as done, scheduled, unscheduled, and available hours.
- Daily, Weekly, and Monthly View: The report allows you to switch between days, weeks, and months.
- Individual Team Member Utilization: Each member’s utilization shows their total hours worked and the percentage of their capacity utilized weekly.
- Totals: The report summarizes the total hours worked by all team members each week.
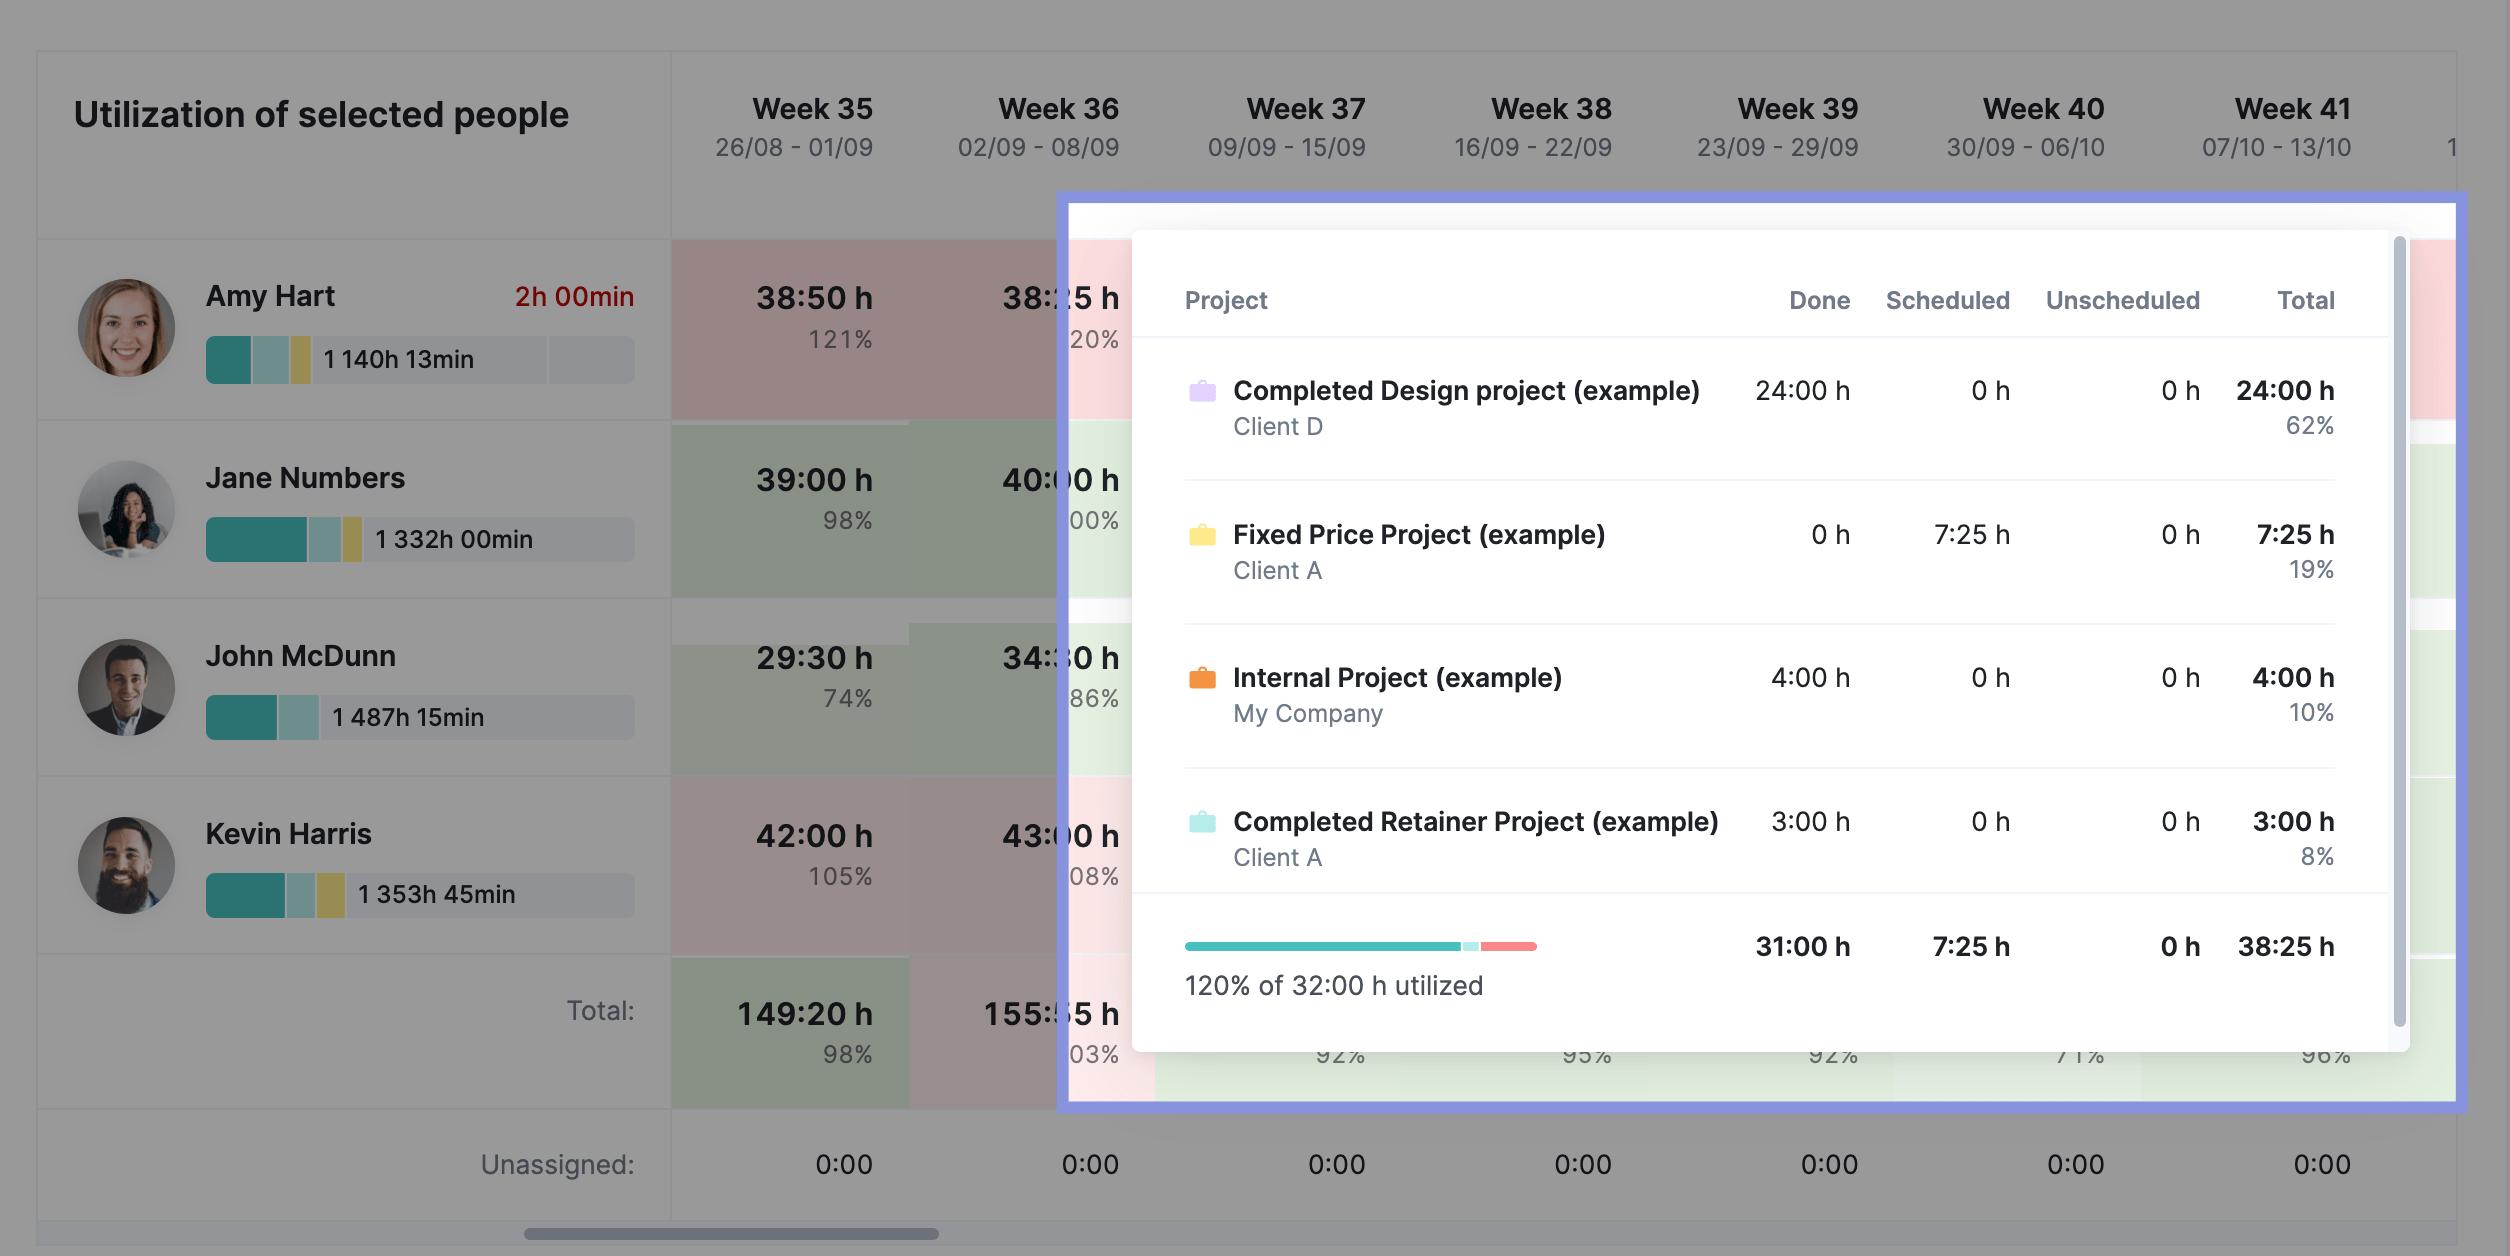
Hover over the utilized hours for a detailed breakdown of time spent on each project. This quick view helps you understand your team’s workload and priorities.
Further Reading: Utilization Report In Scoro
Top Tip
Scoro’s reports library offers a wide range of pre-built reports to analyze productivity, utilization, revenue, cost, profitability, and sales. The reports can help you track time usage, resource allocation, financial performance, and project profitability.
Role-based resource utilization report
A role-based utilization report provides insights into the utilization rates of different job roles or functional groups within an organization. It shows you the utilization hours for copywriters, designers, developers, and other roles over a given time period.
Sometimes, a role-based utilization report might be more appropriate for your needs. It can help you to:
- Analyze resource allocation and workload distribution across different roles or departments
- Identify roles that may be overloaded or underutilized so you can track capacity and rebalance resources where needed
- Assess staffing needs and prioritize hiring efforts
- Understand how much budget various departments and roles need
In Scoro, you can easily generate a role-based utilization report using the “Role” filter in the “Utilization report.”
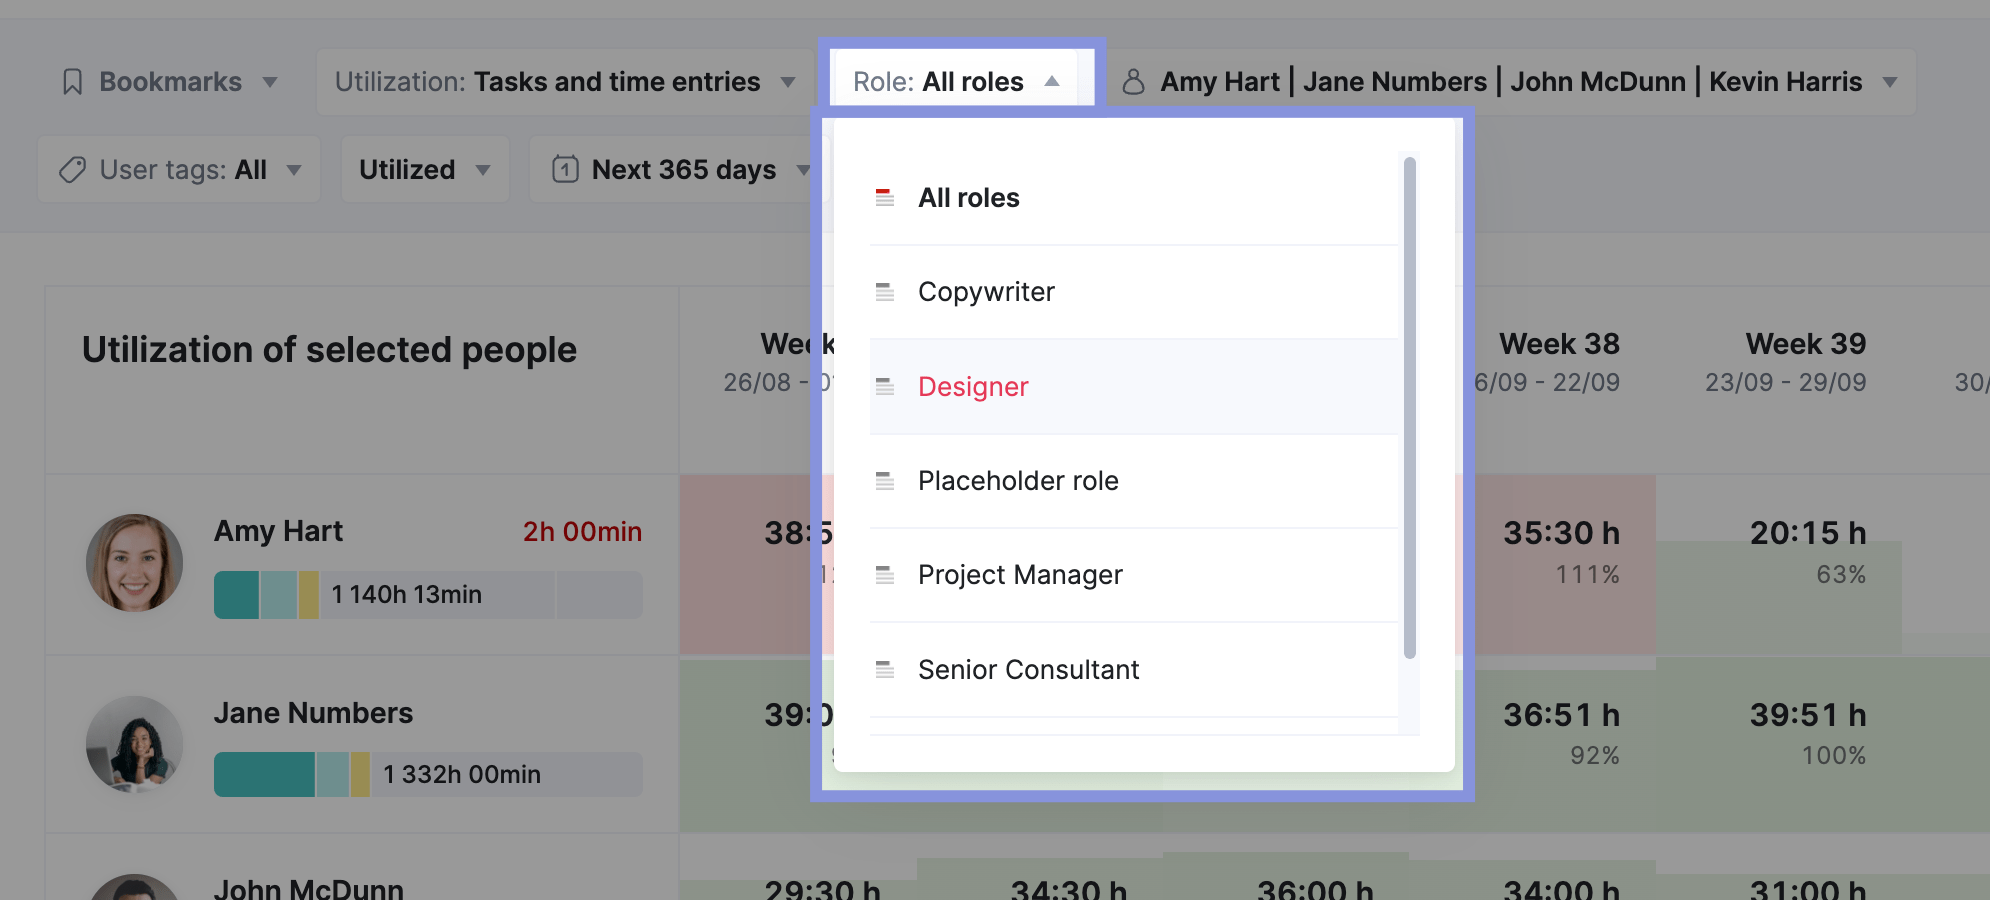
For example, let’s say you have an in-house Designer called John and want to check his utilization for the upcoming weeks.
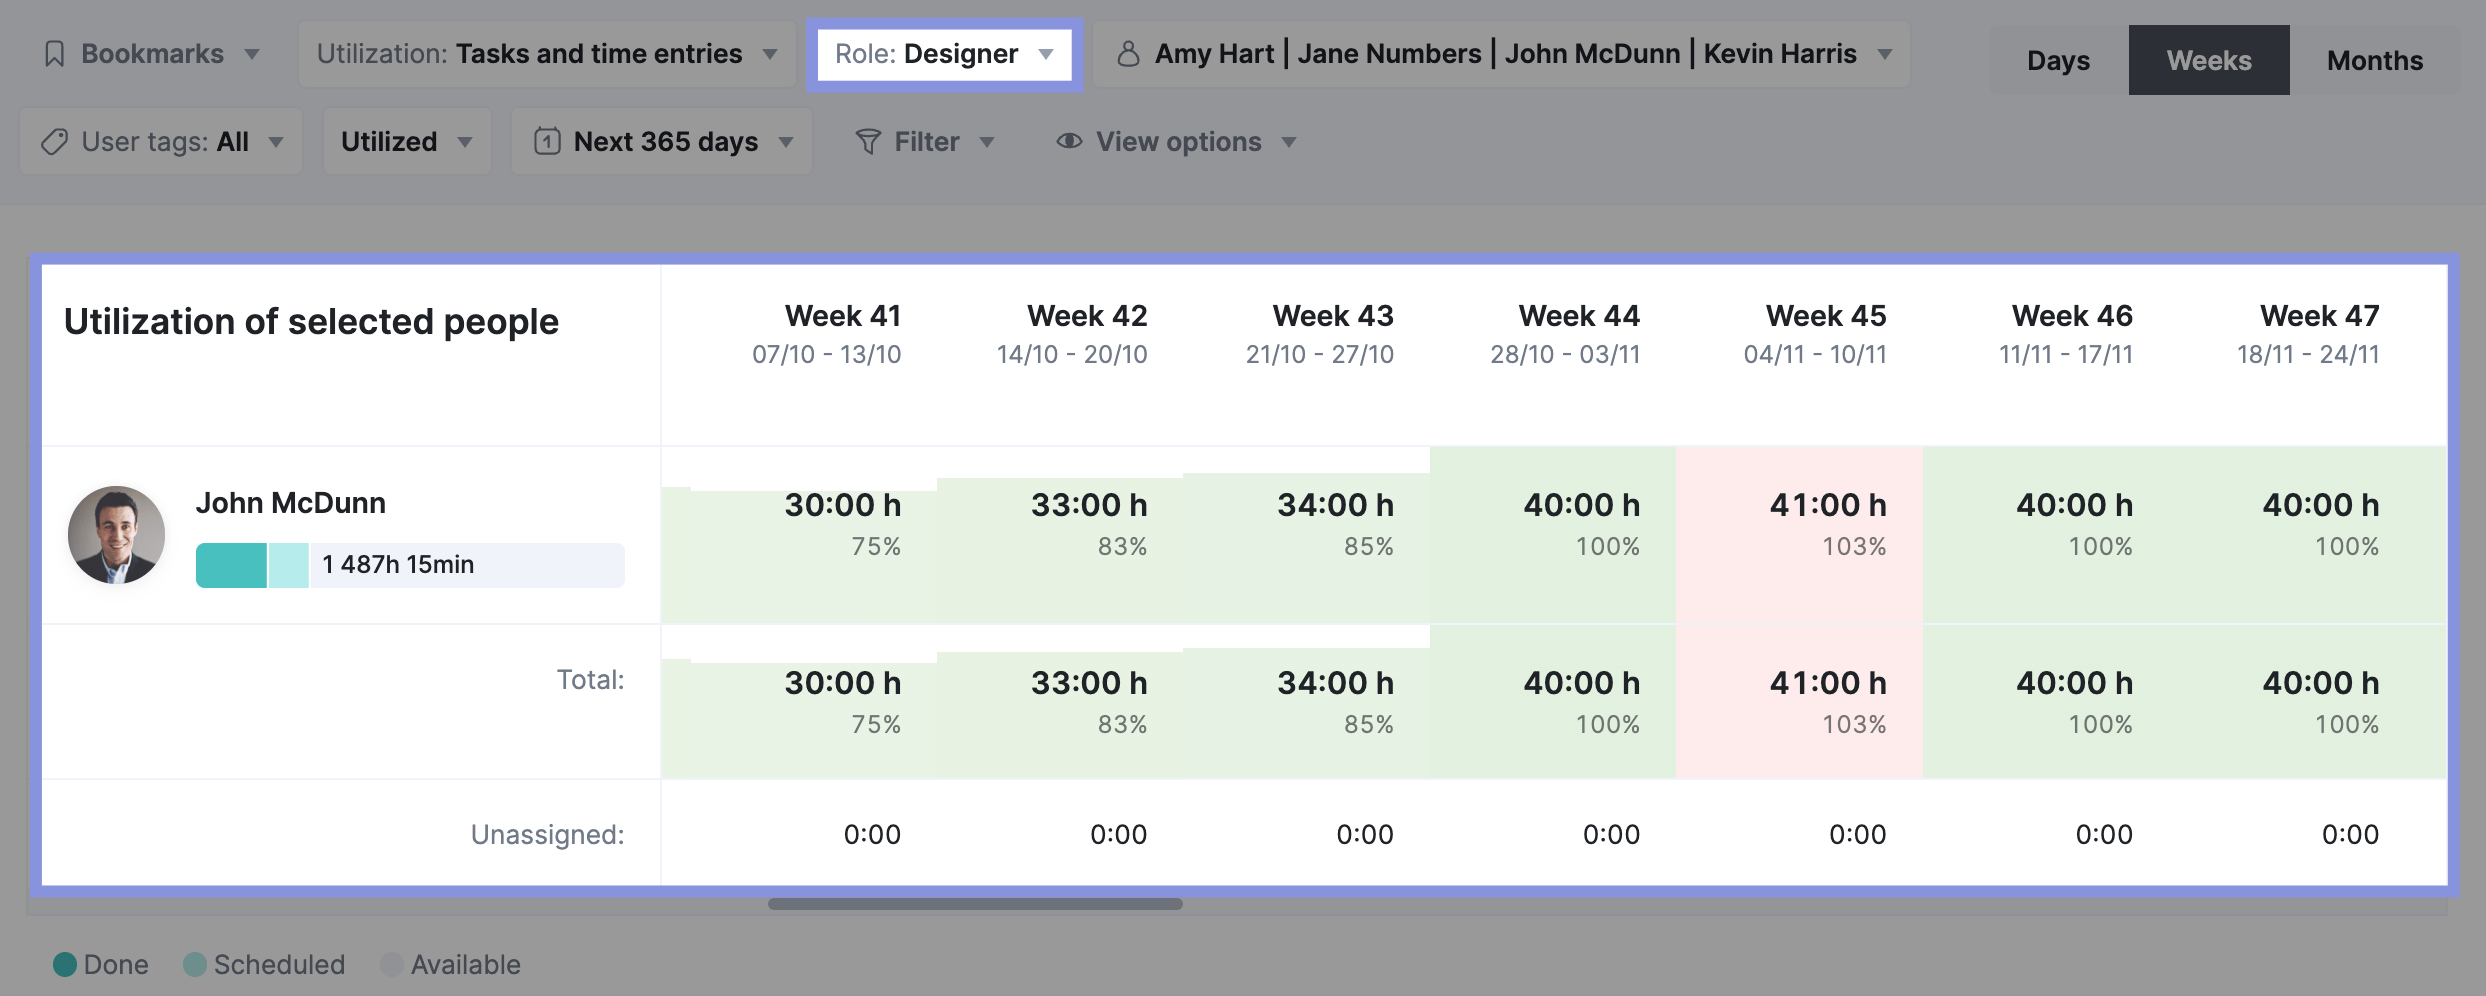
Apply the “Role” filter by “Designer” (or the relevant title). The report will show his planned workload and utilization percentage for future weeks.
In the example below, we can see in week 45, his utilization exceeded 100%, reaching 103%.
This means John is scheduled to work 3% more than his standard available hours. This could be due to a special project, catching up on previous tasks, or overtime. It’s important to monitor this to prevent burnout.
Proactive steps you could take here include:
- Talk to John: Talk with John to understand the context of his workload in week 45. Find out if the additional hours are manageable or if there are any concerns.
- Re-evaluate Deadlines: If the overutilization is due to a project deadline, explore if there’s flexibility to adjust the timeline.
- Redistribute Tasks: Consider delegating some of John’s tasks to other team members to even out the workload.
- Offer Support: Let John know you can support him during this busy period. Encourage him to take breaks and maintain a healthy work-life balance.
- Hire Another Designer: If John’s overutilization becomes a consistent pattern, it’s definitely a sign that you might need to consider hiring another designer.
Billable utilization report
A billable utilization report zeroes in on the percentage of time employees spend on billable work. It provides a clear picture of how much revenue is generated by the team’s efforts.
This report is crucial for understanding profitability and financial performance. And it can help you answer questions such as:
- What is the team or company’s overall billable utilization rate?
- Which employees or roles have the highest and lowest billable utilization rates?
- Are there any trends or patterns in billable utilization over time?
- Which projects or clients are most profitable based on billable utilization?
- Are there any opportunities to increase billable utilization and revenue?
Scoro’s “Utilization report” gives you easy access to billable utilization data.
While it defaults to showing resource utilization (including billable and non-billable hours), you can easily filter the report to focus solely on billable utilization.
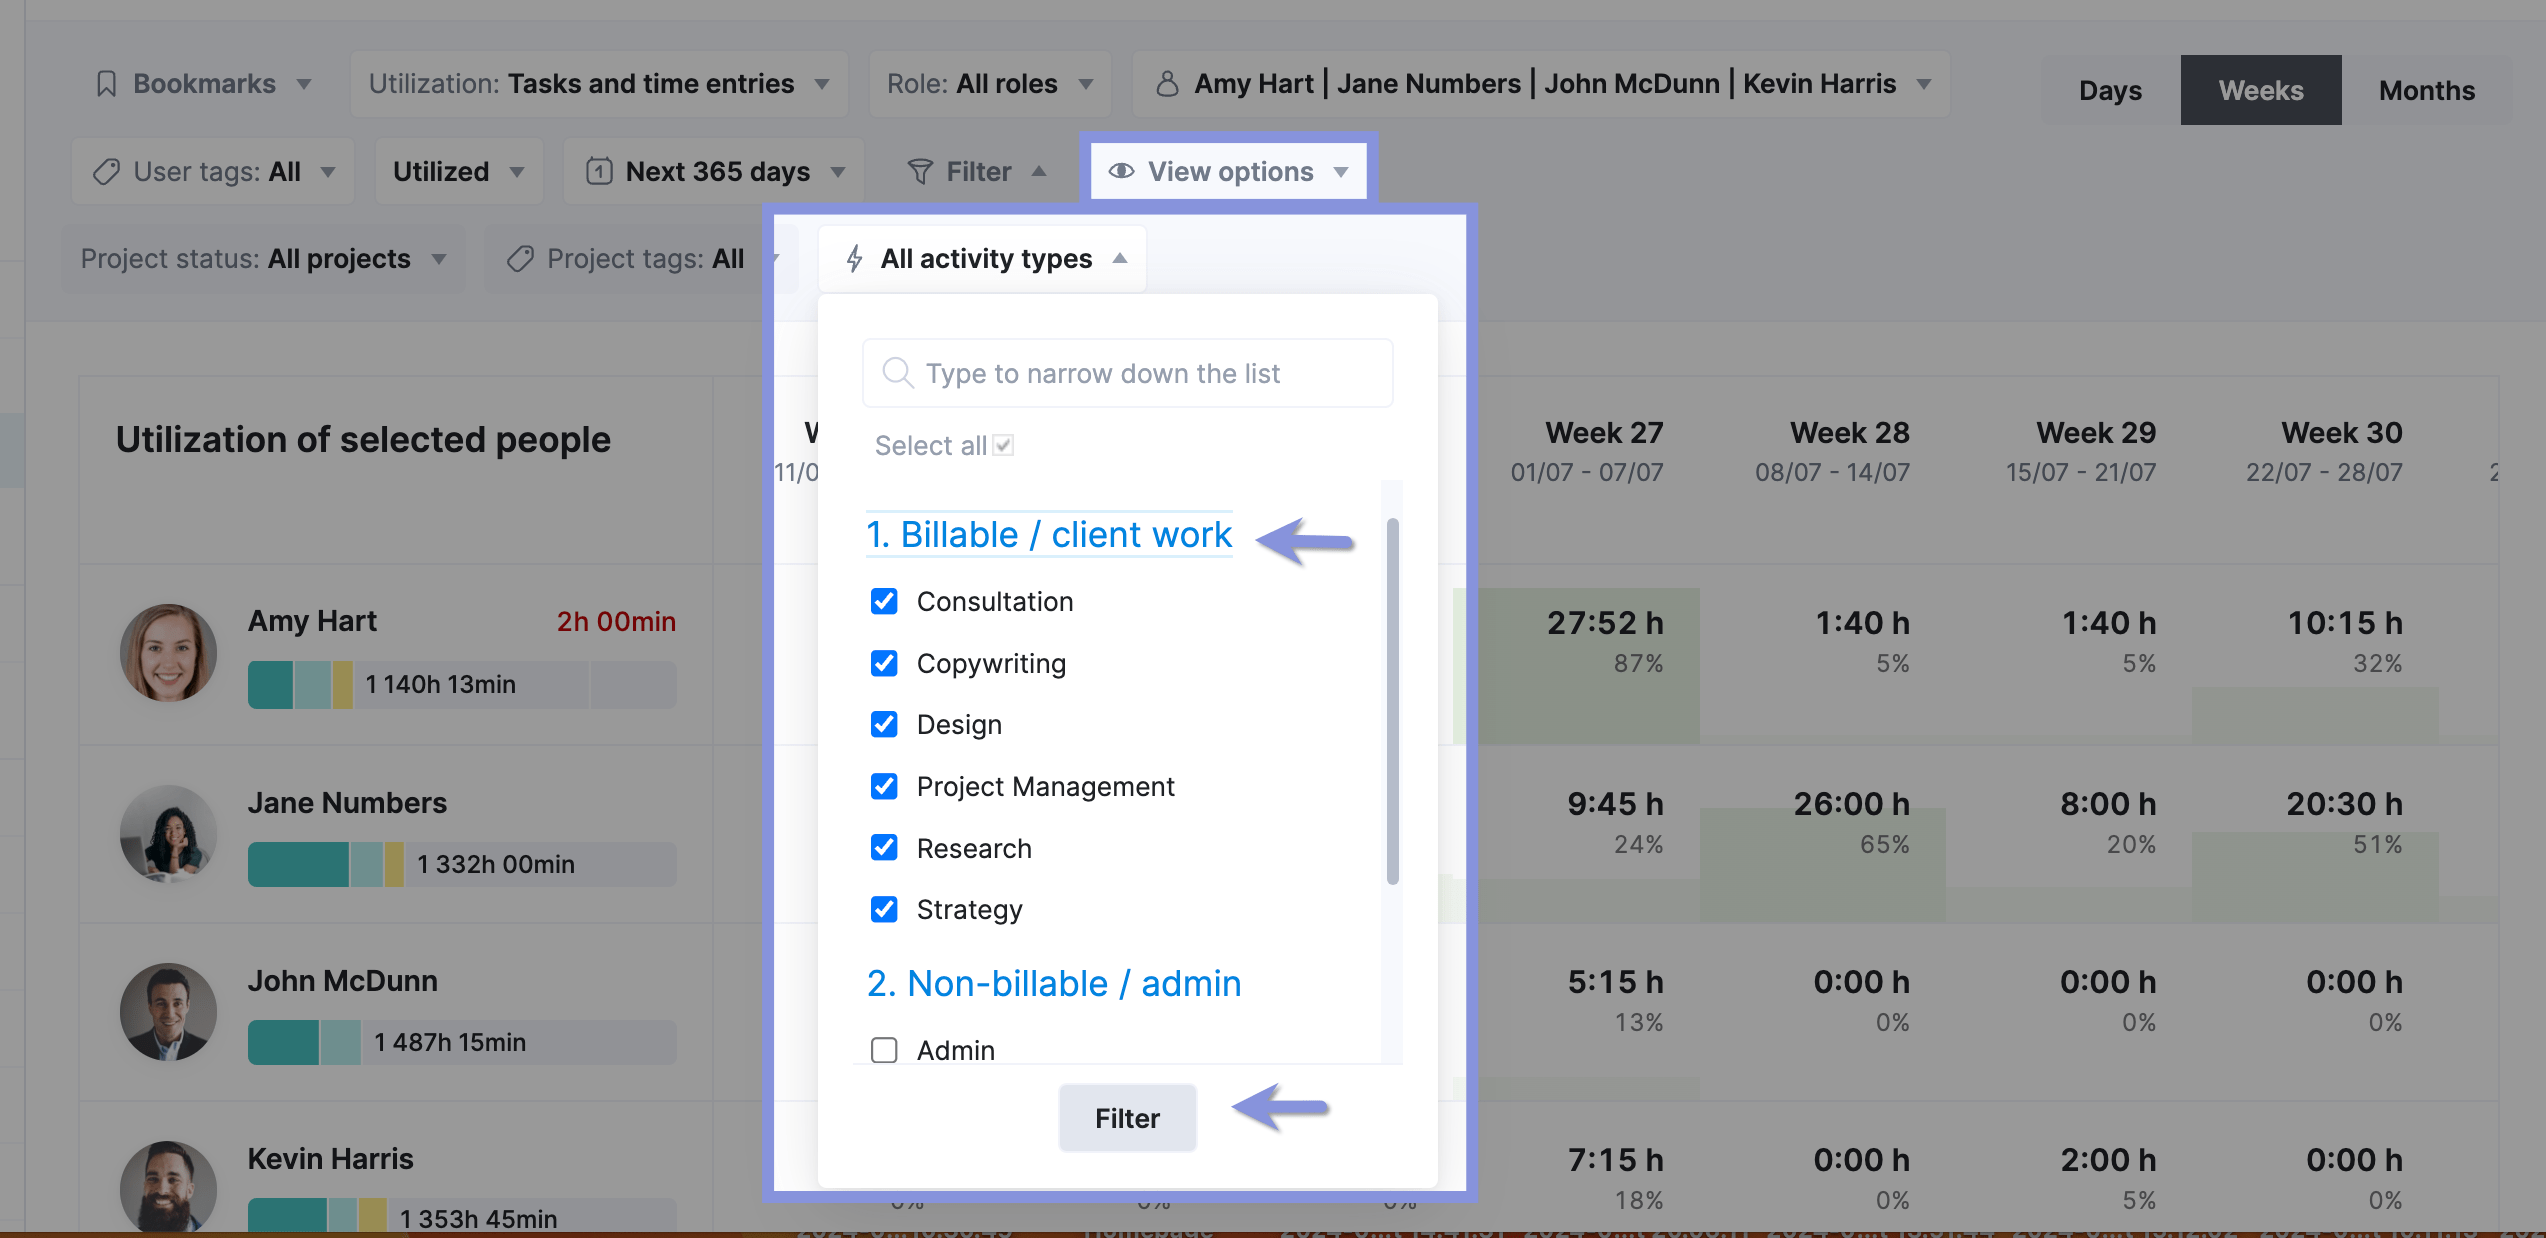
Click the “View options” button located within the report interface.
In the drop-down menu next to “Activity types,” choose “Billable / client work.” This will automatically select all activity types classified as billable in your Scoro settings.
Click the “Filter” button to apply the selected filter.
The “Utilization report” will show your employee’s billable utilization for the selected period.
It will be lower than resource utilization as it doesn’t include non-billable work. But, focusing on billable utilization helps you understand how much of your team’s time directly contributes to revenue generation.
The billable utilization report can help you make informed decisions about project and resource planning, and pricing strategies.
For example, the report below shows that Amy only had a 5% billable utilization in Week 40.
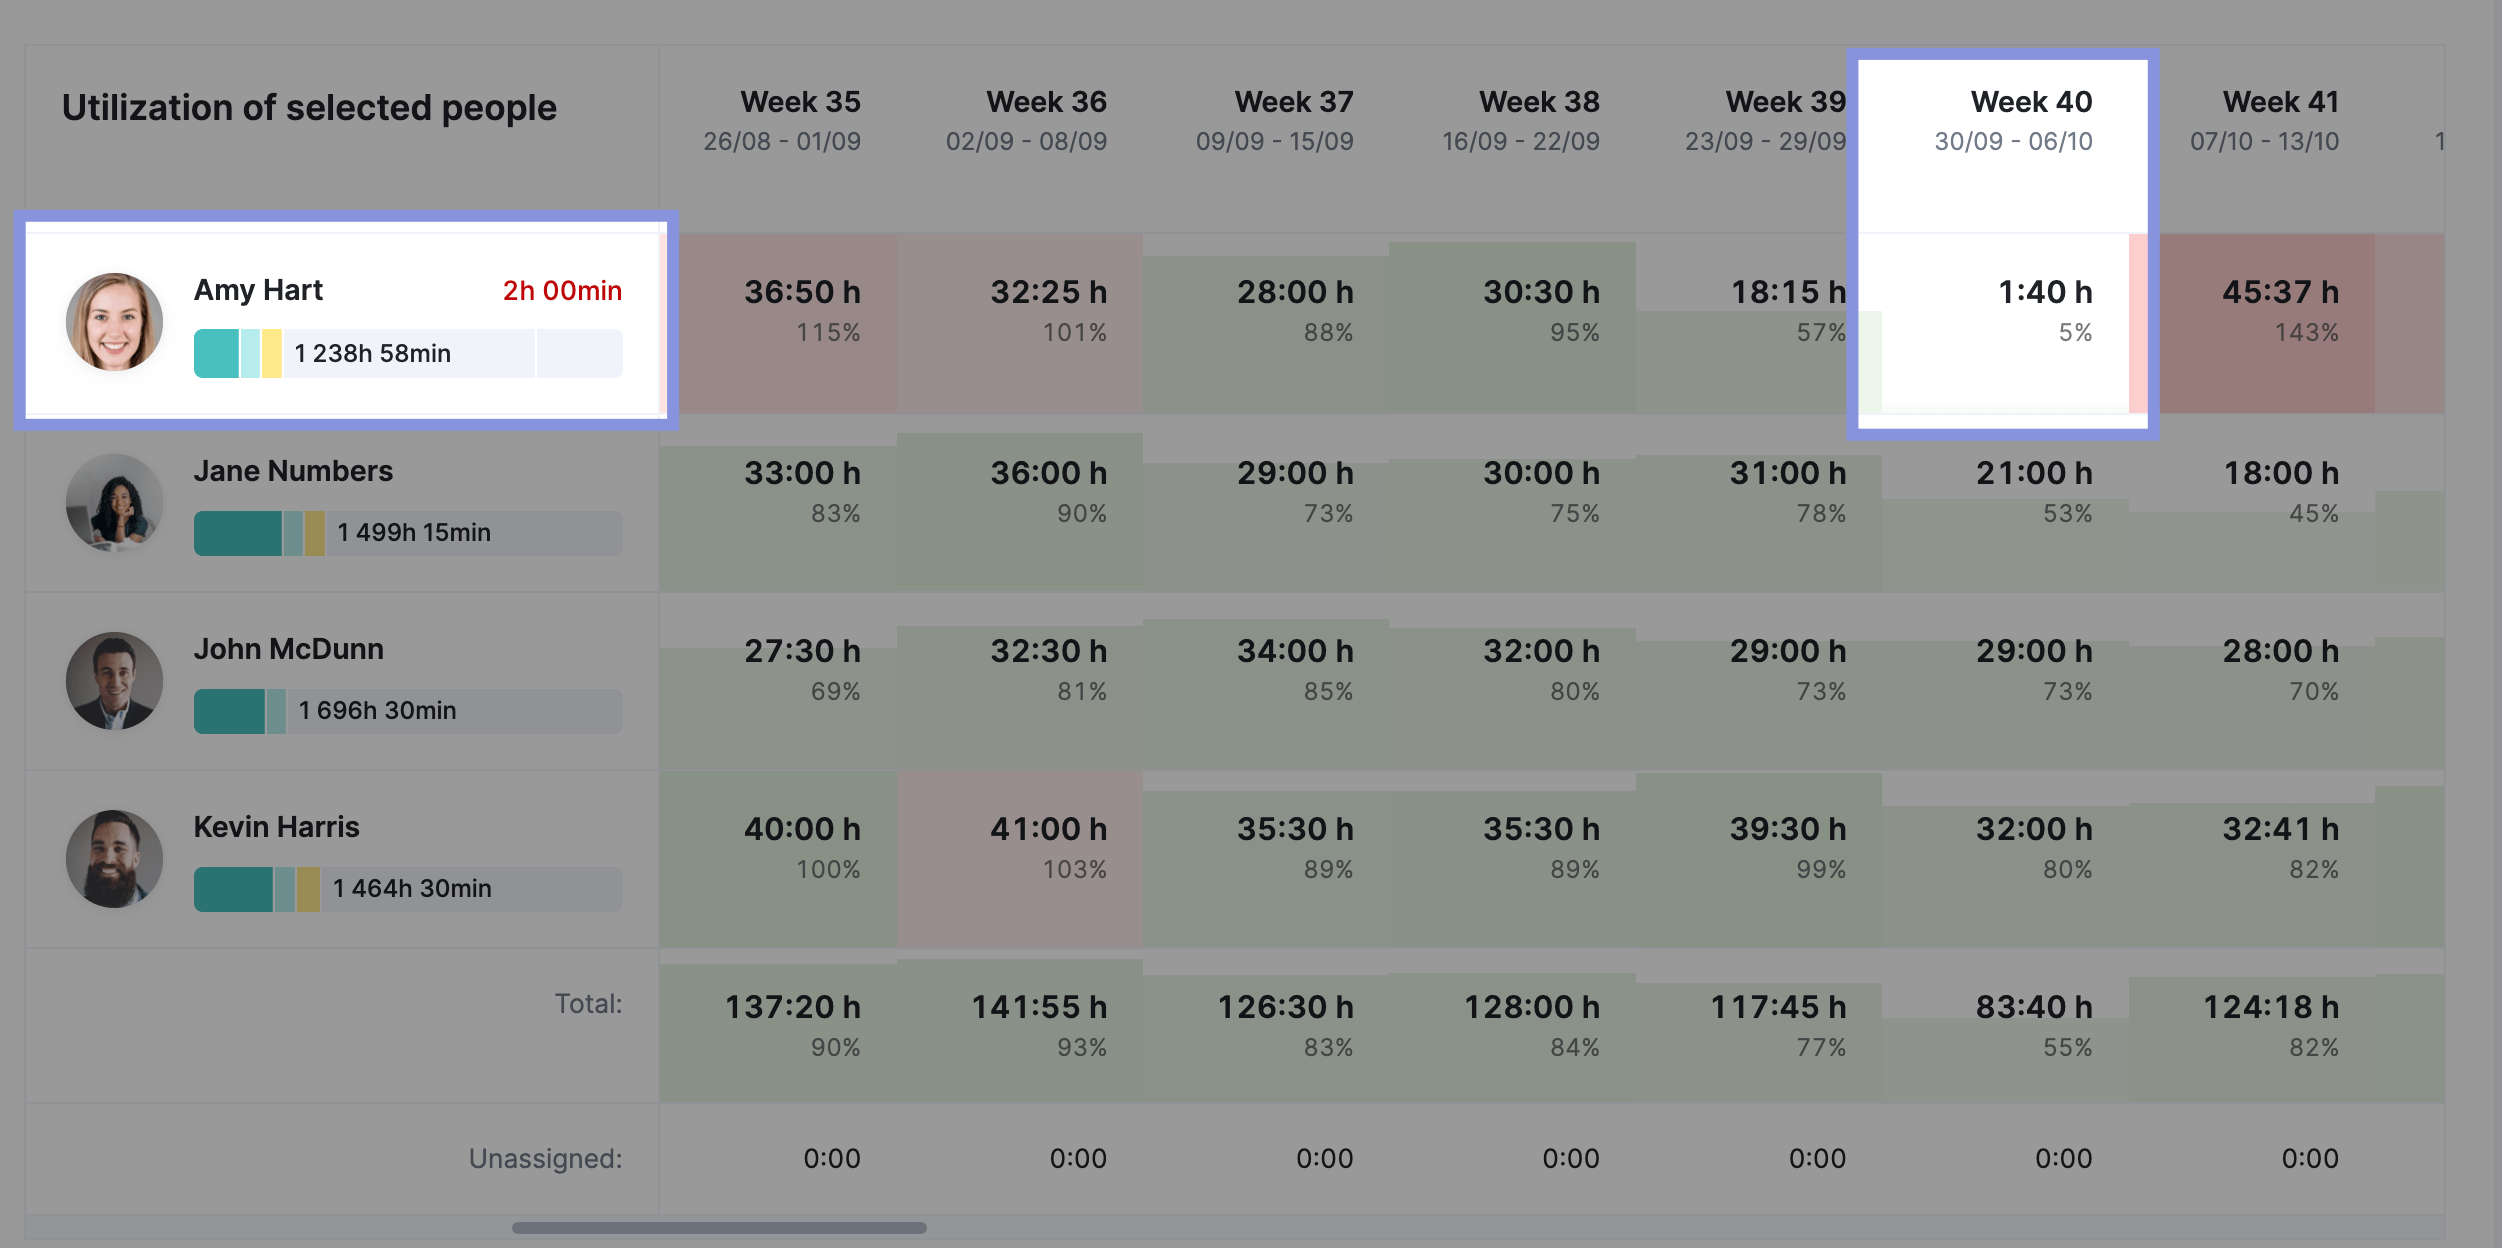
Here are a few actions you might take:
- Talk to Amy: Talk with Amy to understand what she worked on during Week 40 and get her perspective on the low billable utilization.
- Review Time Entries: Look at Amy’s detailed time entries for Week 40 to see exactly how her time was allocated.
And here’s how you might address the root cause:
- Onboarding/Training: If it’s a training issue, provide additional resources or mentorship to help Amy ramp up quickly.
- Internal Projects: If internal work takes up significant time, see if those tasks can be reassigned or postponed.
- Lack of Billable Work: If there are no suitable projects, explore whether Amy’s skills could be leveraged on other projects or if she could take on additional training to expand her skill set.
- Skill Mismatch: If a skill mismatch is an issue, consider adjusting project assignments or providing training to better align Amy’s skills with client needs.
How to create an employee utilization report
Creating an employee utilization report requires careful planning and implementation to ensure accurate and valuable insights.
Here’s a step-by-step guide:
- Establish clear work schedules: Use a scheduling tool to define each team member’s working hours, days off, and daily task capacity. This provides a foundational reference for your utilization calculations.
- Categorize billable vs. non-billable work: Create distinct categories for tasks and projects that generate client revenue (billable) and those that are for internal operations or administration (non-billable). This ensures accurate reporting and analysis.
- Plan and assign work strategically: Utilize project management software to outline project timelines, allocate the right resources to each task, and assign responsibilities to team members. This promotes balanced workloads and maximizes efficiency.
- Implement time tracking: Encourage your team to consistently log their time spent on each task or project using the time-tracking tools available in your software. This data is essential for accurate utilization reports.
- Analyze and act on utilization data: Examine individual and team utilization rates to identify patterns, underutilized capacity, or overloaded team members. Use these insights to adjust resource allocation and optimize productivity and revenue.
Further Reading: We’ve detailed this process in our Employee Resource Utilization 101: Your Ultimate Guide.
Harness the power of utilization reports with Scoro
Utilization reports are a powerful tool for managing and optimizing your team’s time.
When you understand how much of your team’s time is scheduled, available, and utilized, you can make smarter decisions about project resources and timelines, which leads to higher employee satisfaction and better project result
Scoro provides deep insights into how your team spends their time. Start your free trial now to get your utilization report in just a few clicks.